This week, our In Focus section reviews highlights and shares key takeaways from the 18th annual Medicaid Budget Survey conducted by The Kaiser Family Foundation (KFF) and Health Management Associates (HMA). Survey results were released on October 25, 2018, in two new reports: States Focus on Quality and Outcomes Amid Waiver Changes: Results from a 50-State Medicaid Budget Survey for State Fiscal Years 2018 and 2019 and Medicaid Enrollment & Spending Growth: FY 2018 & 2019. The reports were prepared by Kathleen Gifford, Eileen Ellis, Barbara Coulter Edwards, and Aimee Lashbrook from HMA, and by Elizabeth Hinton, Larisa Antonisse, and Robin Rudowitz from the Kaiser Family Foundation. The survey was conducted in collaboration with the National Association of Medicaid Directors.
This survey reports on trends in Medicaid spending, enrollment, and policy initiatives for FY 2018 and FY 2019, highlighting policy changes implemented in state Medicaid programs in FY 2018 and those planned for implementation in FY 2019. The conclusions are based on information provided by the nation’s state Medicaid Directors.
Key Report Highlights
In the following sections, we highlight a few of the major findings from the reports. This is a fraction of what is covered in the 50-state survey reports, which include significant detail and findings on policy changes and initiatives related to eligibility and enrollment, managed care, long-term services and supports (LTSS), provider payment rates, and covered benefits (including prescription drug policies). The reports also look at the key issues and challenges now facing Medicaid programs.
Medicaid Enrollment and Spending Growth
Enrollment growth stayed flat in FY 2018 (-0.6 percent) due to a stronger economy, elimination of redetermination delays in states that had previously implemented new or upgraded eligibility systems, and enhanced verifications and data matching in a number of states. Since peaking in FY 2015 as a result of the Affordable Care Act growth, enrollment has continued to slow. Growth in FY 2019 is predicted to be 0.9 percent. Total Medicaid spending experienced a steady growth at 4.2 percent in FY 2018 and is projected to increase 5.3 percent in FY 2019 because of higher costs for prescription drugs, long-term services and supports and behavioral health services, and policy decisions to implement targeted provider rate increases. The declining federal match for the expansion group resulted in state Medicaid spending growth outpacing total spending growth in FY 2018. However, states predict that total spending growth will increase faster than state spending growth for FY 2019.
Figure 1 – Medicaid Enrollment and Spending Growth, FY 2017-18 and FY 2019 (Projected)
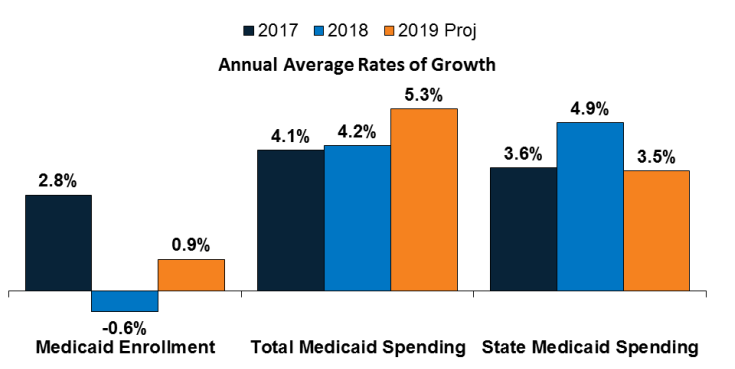
SOURCE: Enrollment growth for FY 2017‐2018 is based on KFF analysis of CMS, Medicaid & CHIP Monthly Applications, Eligibility Determinations, and Enrollment Reports. The spending growth rate for FY 2017 is derived from KFF Analysis of CMS Form 64 Data. All other growth rates are from the KFF survey of Medicaid officials in 50 states and DC conducted by Health Management Associates, October 2018.
Medicaid Eligibility Standard Changes
- Eligibility restrictions implemented in FY 2018 (by six states) or planned for implementation in FY 2019 (in 11 states) through Section 1115 waivers could result in enrollment declines. These restrictions include eight states implementing or planning to implement work or community engagement requirements as a condition of Medicaid eligibility, eight states eliminating or restricting retroactive eligibility, and three states implementing or proposing lock-out periods for non-payment of premiums, failure to complete redetermination, and/or failure to timely report changes affecting eligibility.
- Idaho, Nebraska, and Utah could adopt the ACA Medicaid expansion through November 2018 ballot initiatives.
Medicaid Managed Care Initiatives
- A total of 39 states (including DC) contract with risk-based managed care organizations (MCOs) to serve their Medicaid enrollees. As of July 2018, 33 states reported that 75 percent or more of their Medicaid beneficiaries were enrolled in MCOs. Children and adults, particularly those enrolled through the ACA Medicaid expansion, are much more likely to be enrolled in an MCO than elderly Medicaid beneficiaries or individuals with disabilities.
Figure 2 – MCO Penetration Rates for Select Groups of Medicaid Beneficiaries, as of July 1, 2018
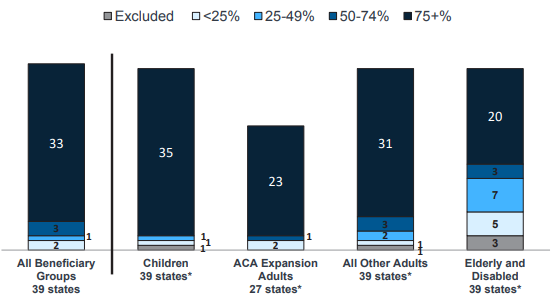
SOURCE: KFF survey of Medicaid officials in 50 states and DC conducted by HMA, October 2018.
- Alaska and Arkansas reported plans to implement an MCO program for the first time in FY 2019.
- Because of nearly full MCO saturation in most MCO states, only five states in FY 2018 and five states in FY 2019 reported actions to increase MCO enrollment.
- In FY 2018, Mississippi and South Carolina reported actions to carve behavioral health services into their MCO contracts, and Washington reported implementing integrated MCO contracts in additional geographic areas.
Emerging Delivery System and Payment Reforms
- Forty-three states had one or more delivery system or payment reform initiatives in place in FY 2018, including patient-centered medical homes (PCMHs), ACA Health Homes, accountable care organizations (ACOs), episode of care payments, or delivery system reform incentive programs (DSRIPs). PCMH and health home initiatives were the most common in FY 2018.
Figure 3 – State Delivery System Reform Activity, FYs 2018-2019
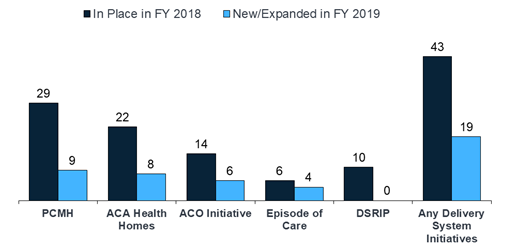
SOURCE: KFF survey of Medicaid officials in 50 states and DC conducted by HMA, October 2018.
Long-Term Services and Supports Reforms
- Nearly every state reported actions to expand the number of people served in home and community-based settings in both years (46 states in FY 2018 and 48 states in FY 2019).
Figure 4 – State Long-Term Care Actions to Serve More Individuals in Community Settings, FYs 2018-2019

SOURCE: KFF survey of Medicaid officials in 50 states and DC conducted by HMA, October 2018.
- Housing supports are an increasingly important part of state LTSS benefits, even as Money Follow the Person (MFP) grant funds expire. Thirty states reported that they plan to continue to offer housing-related supports after MFP funding expires. However, about half of MFP-funded states anticipate they will have to discontinue some services or administrative activities.
- Twenty-four states reported using one or mode MLTSS model, as of July 1, 2018, with nine offering an MCO-based Financial Alignment Demonstration (FAD). Pennsylvania introduced MLTSS in FY 2018, with a plan to phase-in statewide over time. Virginia ended its Financial Alignment Demonstration (FAD) but adopted statewide MLTSS for a broader population, including dual eligible individuals. Arkansas expects to adopt MLTSS in FY 2019.
Provider Rates and Taxes
- Over half of MCO states (21 of 39) require MCO payments changes for some or all types of providers to be consistent with percentage or level changes made in comparable fee-for-service (FFS) rates. Twenty-seven states reported that their MCO contracts include rate floors for some provider types, and five states reported they had minimum MCO payment requirements for all types of Medicaid providers.
Figure 5 – Provider Rate Changes Implemented in FY 2018 and Adopted for FY 2019
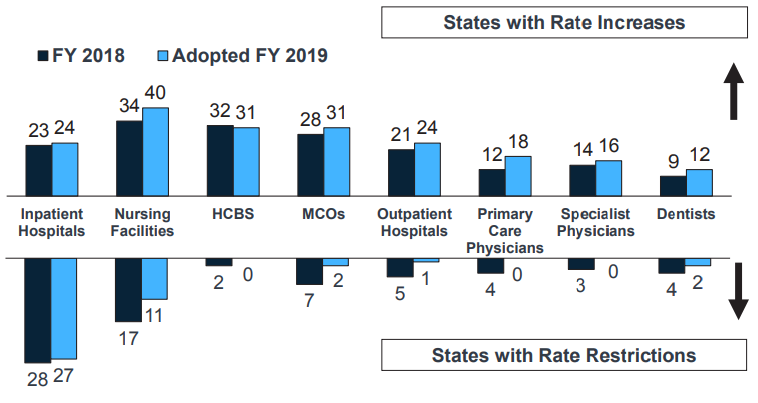
SOURCE: KFF survey of Medicaid officials in 50 states and DC conducted by HMA, October 2018.
- In FY 2018, 36 states, including DC, had three or more provider taxes in place. Twenty-nine states have at least one provider tax that is at or above 5.5% of net patient revenues (close to the maximum safe harbor threshold of 6%). Therefore, federal action to lower that threshold as proposed in the past would have financial implications for many states.
Benefits and Copayments
- The number of states reporting new benefits and benefit enhancements continues to significantly outpace the number of states reporting benefit cuts and restrictions. Nineteen states expanded or enhanced covered benefits in FY 2018, and 24 states plan to add or enhance benefits in FY 2019. The most common benefit enhancements reported were for mental health/substance use disorder (SUD) services (including waiver of the IMD exclusion for SUD treatment).
- Eight states reported new or increased copayment requirements for FY 2018 or FY 2019, including for non-emergency use of a hospital emergency department (ED) and for pharmacy services.
Pharmacy and Opioid Strategies
- All states reported FFS pharmacy management strategies to reduce opioid harm in FY 2018. Of the 35 states that used MCOs to deliver pharmacy benefits, 26 reported that they required MCOs to follow some or all of their FFS pharmacy management policies for opioids.
- States continue to increase access to Medication Assisted Treatment (MAT) for opioid use disorder, and 38 states reported coverage of methadone in FY 2018.
Looking Ahead: Perspectives of Medicaid Directors
When asked to identify the top priorities, issues, and challenges for FY 2018 and beyond, Medicaid directors listed the following:
- Improving quality and focusing on health outcomes
- Section 1115 Medicaid demonstration waivers
- Opioid Epidemic
- Medicaid Management Information Systems (MMIS) procurements and eligibility system upgrades and replacements
- Ongoing federal legislative proposals