This week, our In Focus section reviews highlights and shares key takeaways from the 17th annual Medicaid Budget Survey conducted by Health Management Associates (HMA) and the Kaiser Family Foundation (KFF). Survey results were released on October 19, 2017, in three new reports: “Medicaid Enrollment & Spending Growth: FY 2017 & 2018,” “Medicaid Moving Ahead in Uncertain Times: Results from a 50-State Medicaid Budget Survey for State Fiscal Years 2017 and 2018,” and “Putting Medicaid in the Larger Budget Context: An In-Depth Look at Three States in FY 2017 and 2018.” The reports were prepared by Kathleen Gifford, Eileen Ellis, Barbara Coulter Edwards, and Aimee Lashbrook from HMA, and by Elizabeth Hinton, Larisa Antonisse, Allison Valentine, and Robin Rudowitz from the Kaiser Family Foundation. HMA’s Dennis Roberts also contributed. The survey was conducted in collaboration with the National Association of Medicaid Directors.
This survey reports on trends in Medicaid spending, enrollment, and policy initiatives for FY 2017 and FY 2018, highlighting policy changes implemented in state Medicaid programs in FY 2017 and those planned for implementation in FY 2018 based on information provided by the nation’s state Medicaid Directors.
Key Report Highlights
In the following sections, we highlight a few of the major findings from the reports. This is a fraction of what is covered in the 50-state survey reports, which include significant detail and findings on policy changes and initiatives related to eligibility and enrollment, managed care, long-term services and supports (LTSS), provider payment rates, and covered benefits (including prescription drug policies). The reports also look at the key issues and challenges now facing Medicaid programs.
Medicaid Enrollment and Spending Growth
After significant increases in FY 2015 associated with the implementation of the ACA Medicaid expansion, last year’s survey anticipated a slowdown in Medicaid spending and enrollment growth, which was confirmed by this year’s report. Medicaid enrollment growth slowed to 2.7 percent nationally in FY 2017, down from 3.9 percent in FY 2016. Total spending growth was stable at 3.9 percent, up only slightly from 3.5 percent the previous year. State Medicaid spending experienced a slight uptick from 2.4 percent in FY 2016 to 3.5 percent in FY 2017, as states that implemented the Medicaid expansion started to pay 5 percent of the costs of those enrollees in January 2017 (mid-way through the state fiscal year).
Figure 1 – Medicaid Enrollment and Spending Growth, FY 2016-2017 and FY 2018 (Projected)
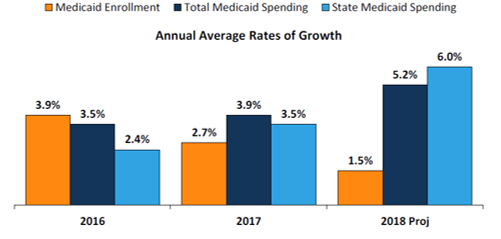
SOURCE: Enrollment growth for FY 2016‐2017 is based on KFF analysis of CMS, Medicaid & CHIP Monthly Applications, Eligibility Determinations, and Enrollment Reports, accessed September 2017. The spending growth rate for FY 2016 is derived from KFF Analysis of CMS Form 64 Data. All other growth rates are from the KFF survey of Medicaid officials in 50 states and DC conducted by Health Management Associates, October 2017.
Medicaid Eligibility Standard Changes
- As of October 2017, 32 states have implemented the expansion (Louisiana was the latest state to adopt the expansion in FY 2017). Only a few states adopted other Medicaid eligibility expansions for FYs 2017 or 2018, and these changes were generally narrow in scope and targeted to a limited number of beneficiaries. The majority of states have policies in place to provide Medicaid coverage of inpatient care for those incarcerated in prisons or jails, to facilitate enrollment in Medicaid upon release, and to suspend, rather than terminate, Medicaid eligibility for incarcerated individuals.
- For FY 2018, several states are seeking Medicaid eligibility restrictions through Section 1115 waivers that apply to ACA Medicaid expansion and/or traditional Medicaid populations, including the addition of work requirements, elimination of retroactive eligibility, and elimination of Medicaid expansion coverage for those with income above 100 percent of the federal poverty level (FPL).
Medicaid Managed Care Policy Changes
- A total of 39 states (including DC) contract with risk-based managed care organizations (MCOs) to serve their Medicaid enrollees. As of July 2017, 29 states reported that 75 percent or more of their Medicaid beneficiaries were enrolled in MCOs.
- Because of nearly full MCO saturation in most MCO states, only a few states reported actions to increase MCO enrollment. Although many states still carve-out behavioral health services from MCO contracts, movement to carve-in these services continues.
Figure 2 – MCO Penetration Rates for Select Groups of Medicaid Beneficiaries, as of July 1, 2017
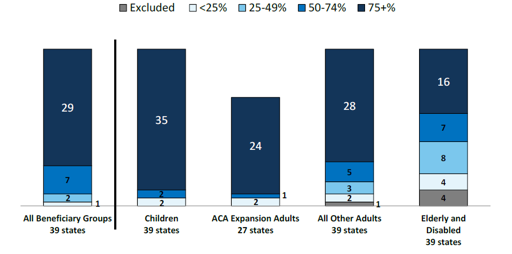
SOURCE: KFF survey of Medicaid officials in 50 states and DC conducted by HMA, October 2017.
- Twenty-six of the 39 MCO states reported that they plan to use authority to receive federal matching funds for adults receiving inpatient psychiatric or substance use disorder (SUD) treatment in an institution for mental disease (IMD) for no more than 15 days a month included in the 2016 managed care regulations.
- States are using MCO arrangements to increase attention to the social determinants of health and to promote value-based payment. States are increasingly requiring MCOs to screen beneficiaries for social needs (19 states in FY 2017 and 2 additional states in FY 2018); to provide care coordination pre-release to incarcerated individuals (6 states in FY 2017 and 1 additional state in FY 2018); and to use alternative payment models (APMs) to reimburse providers (13 states in FY 2017 set a target percentage of MCO provider payments that must be in an APM and 9 additional states plan to set targets in FY 201).
Emerging Delivery System and Payment Reform Initiatives
- Forty states have one or more delivery system or payment reform initiatives in place in FY 2017 (e.g., patient-centered medical home (PCMH), ACA Health Home, accountable care organization (ACO), episode of care payment, or delivery system reform incentive program (DSRIP)).
- Six states reported episode of care initiatives in place in FY 2017 (up from only two states in FY 2015). For FY 2018, four of these states reported expanding these initiatives and three states reported new episode of care initiatives. Although states continue to show interest in DSRIP initiatives (that emerged under the Obama administration), the future of DSRIP remains unclear under the new administration
Figure 3 – Number of States with Delivery System Reform Activity, FYs 2017-2018
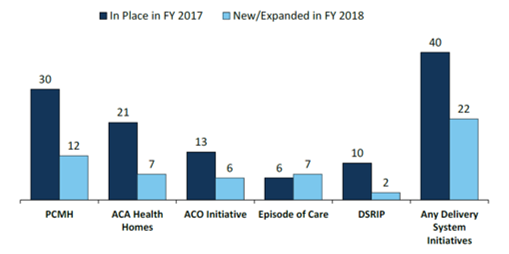
SOURCE: KFF survey of Medicaid officials in 50 states and DC conducted by HMA, October 2017.
Long Term Services and Supports (LTSS)
- Nearly every state reported actions to expand the number of persons served in community settings in both years (46 states in FY 2016 and 47 states in FY 2017).
Figure 4 – State Long-Term Care Actions to Serve More Individuals in Community Settings, FYs 2017-2018
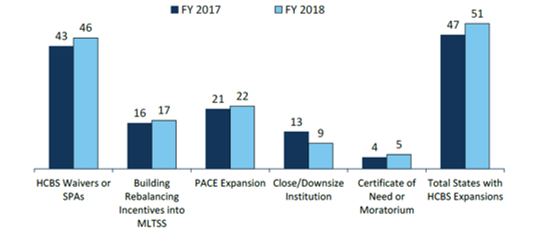
SOURCE: KFF survey of Medicaid officials in 50 states and DC conducted by HMA, October 2017.
- Housing supports are an increasingly important part of state LTSS benefits. Over half of states (27) reported that they implemented or expanded housing-related activities in FY 2017 or FY 2018 (up from 16 states reported last year).
Provider Rates and Taxes
- About half of MCO states (18 of 39) require MCO rates to follow FFS rate changes for some provider types and two states (Louisiana and Mississippi) require MCO rates to be tied to FFS for all providers. Twenty-four states reported they had MCO rate floors for some provider types, and five states reported they had minimum MCO payment requirements for all types of Medicaid providers.
Figure 5 – Provider Rate Changes Implemented in FY 2017 and Adopted for FY 2018
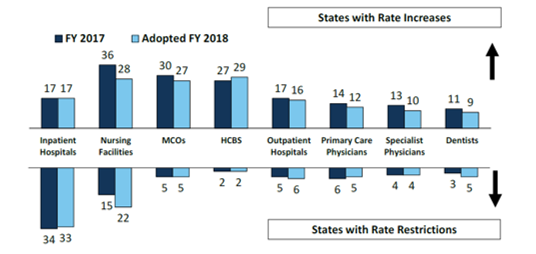
SOURCE: KFF survey of Medicaid officials in 50 states and DC conducted by HMA, October 2017.
- Federal legislation recently under consideration in the Senate proposed to phase down the limit on state use of provider taxes (the “safe harbor threshold”) from the current allowable level, 6.0 percent of net patient revenues, to 5.0 percent of net patient revenues by FY 2025 in one proposal and 4.0 percent by FY 2025 in another. In this year’s budget survey, 29 states reported having at least one provider tax exceeding 5.5 percent of net patient revenues and 46 states reported having at least one provider tax exceeding 3.5 percent as of July 1, 2017. The data suggests that these federal proposals would restrict states’ ability to supply the non-federal share to finance Medicaid and could therefore shift additional costs to states.
Looking Ahead: Perspectives of Medicaid Directors
When asked to identify the top priorities, issues, and challenges for FY 2018 and beyond, Medicaid directors listed the following:
- Federal legislative proposals around the ACA Medicaid expansion and proposed federal Medicaid financing reforms;
- Section 1115 Medicaid demonstration waivers;
- Payment and delivery system reform initiatives;
- Substance use disorder treatment initiatives;
- Long term services and supports; and
- Medicaid infrastructure development.