Blog

Highlights from HMA Analysis of Specialty Services in Medicaid

This week, our In Focus section highlights key insights from a new Health Management Associates (HMA), white paper, Concentration of Specialty Services in Medicaid. Experts from HMA and Wakely, an HMA company, used the national Transformed Medicaid Statistical Information System (T-MSIS) database to learn more about specialty provider networks and examine the provision of specialty services across various states.  

The analysis, released in January 2025 with support from the Robert Wood Johnson Foundation, focuses on three representative services that are relatively common, potentially difficult for Medicaid beneficiaries to access, significantly affect quality of life, typically accessed as elective procedures, and unlikely to be provided by other clinicians, such as primary care or mid-level practitioners.  

T-MSIS Analysis Overview  

T-MSIS analytic files are a comprehensive resource for Medicaid encounter, beneficiary demographics, program enrollment, service utilization, and payment data. Individual states compile their Medicaid claims data and submit monthly files to the Centers for Medicare & Medicaid Services (CMS). As each state submits data individually, numerous state-specific variations occur in data availability and quality. Currently, T-MSIS data are available for 2016−2023. HMA data scientists have permission to use the T-MSIS files for healthcare services research. 

This paper examines services in 10 states that met a threshold of data integrity in the T-MSIS dataset for 2022. Other important design aspects of the analysis are as follows:  

  • The three service procedures included in the analysis are total knee replacement (TKA), cataract removal, and impacted tooth extraction. 
  • Selected states represented a diverse sample of geographic, socioeconomic, and other demographic factors.  
  • The analysis includes non-dually eligible adult populations, ages 22−64 years.  
  • The data cover all services provided in 2022 for each procedure and the providers who rendered the service; facilities are excluded.  

Concentration of Specialty Providers  

Table 1 summarizes findings about the concentration of specialty services.  
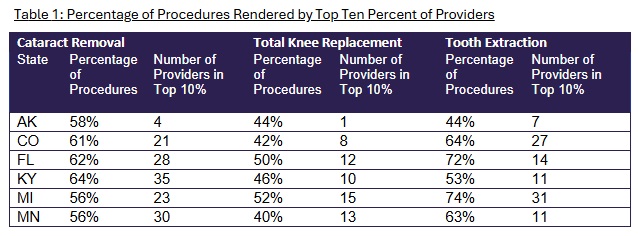
table of percentage of procedures rendered by top ten percent of providers

The authors further analyzed the provision of services and, building on a previous study, examined network concentration. Findings were as follows: 

  • When looking at the same procedure across states, no consistent pattern emerged regarding which states had the highest and lowest concentration of services in the top 10/25 percentile of providers. 
  • However, when looking at the same procedure across multiple states, TKA tended to have the lowest concentration of services among those studied.  
  • Regardless of procedure and state, the 50 percent of providers with the lowest number of procedures tended to provide fewer than 10 percent of the total services combined. 

These findings suggest that the specialty networks within each state are highly nuanced, and state policymakers need to look at individual specialty networks when considering health policy. State policymakers and managed care organizations (MCOs) need to examine each specialty individually to assess the distribution of services and access to care. 

Looking Ahead  

Timely access to healthcare services is critical for ensuring optimal health outcomes. The report authors’ analysis of T-MSIS data showed significant concentration of selected specialty services among providers, which may affect appropriate access to these services.  

The analysis of concentration of specialty services among Medicaid specialty providers can guide MCOs and state policymakers in developing strategies to improve network adequacy, including clarifying the level of network adequacy and developing policies to assess and regulate access to specialty care. Addressing gaps in access to specialty care can contribute to better health outcomes for Medicaid beneficiaries and may be aligned with provisions in value-based contracts.  

Connect with Us 

Medicaid consumers, providers, MCOs, and states all have an interest in ensuring access to specialty care for Medicaid beneficiaries. The methodology applied in the analysis for the HMA white paper can be applied and adapted for future analysis to monitor network stability and to compare access among various payers.  

For details about this analysis, its implications for state and local policies, and additional research using T-MSIS, contact our experts below.
Could Congress Compromise Ohio’s Budget through Medicaid?

As policymakers engage the state budget process, Medicaid continues to play a critical role. This role is programmatic, serving as the source of coverage for 1 in 4 Ohioans, including as the finance mechanism for half of all births in the state and the primary source of coverage for the elderly and disabled. However, a number of proposals are currently being discussed by the House, including changing how poverty programs are adjusted for inflation, reversing some Medicaid payment expansions, lowering the minimum federal funding rate for Medicaid, making the federal funding rate the same for all Medicaid expansion populations, limiting taxes on Medicaid providers, capping the amount spent per Medicaid enrollee, standardizing how administrative costs are matched, and other unspecified changes to Medicaid funding through Medicaid match. But these proposals can’t be viewed in isolation because the program is deeply intertwined with Ohio’s ability to have a balanced budget, serving a role in reducing direct state spending by enabling the draw down of federal dollars through “FMAP.” But what is FMAP and what happens if Congress fundamentally changes how it’s calculated?

FMAP

The Federal Medical Assistance Percentage (FMAP) is a critical component of Medicaid funding, ensuring that states receive federal support to provide healthcare services to low-income individuals. FMAP is calculated based on a state’s per capita income relative to the national average. States with lower per capita incomes receive a higher FMAP, meaning the federal government covers a larger share of Medicaid costs, while states with higher per capita incomes receive a lower FMAP. The FMAP formula ensures that states with greater financial need, like Ohio, receive more federal assistance. For Federal Fiscal Year (FFY) 2025, Ohio’s FMAP is 64.6%, which means that for every dollar Ohio spends on most Medicaid services, 64.6 cents comes from the federal government. Even then, much of the state share is financed through fees on entities like hospitals, nursing facilities and health insurance companies.  

Contextually, Ohio is a “recipient state,” indicating it receives more in federal tax revenue than it collects to finance the program. And, as was noted in the initial testimony offered in the Ohio House, Ohio continues to lag other states in terms of economic growth and has an aging population. As such, the availability and predictability of federal funding is a critical input in future years, particularly in long term care where most of the expense will continue to increase. With Congress deliberating all of these proposals, what could the impact be in Ohio? To illustrate, it may be good to focus on one area: the elimination of enhanced federal funding for those covered by the Medicaid expansion.

Impacts

There has been some discussion during testimony that if the FMAP rate for the expansion population were to change, it could trigger an automatic end to the expansion itself.  Importantly, there would be a disproportionate impact in Ohio’s rural counties where expansion coverage rates are higher. In fact, as of December 2024, 362,829 individuals in rural Ohio counties received their coverage through expansion, alone. These individuals, in addition to the 1.1 million others in these Ohio counties, rely on Medicaid for essential healthcare services, including addiction treatment.

In states with expansion, coverage for individuals with SUD has doubled highlighting the importance of maintaining robust funding for these programs. Expansion has also been the primary source of funding for addiction treatment in the state, with Medicaid covering half of all buprenorphine treatments. If expansion were eliminated due to the change in FMAP, the consequences for treatment may mean either a greater obligation on the state to finance those services directly, or, Ohio may exacerbate the opioid use disorder crisis, putting additional strain on our healthcare system, particularly for behavioral health providers.

Conclusion

As we consider the future of Ohio’s Medicaid expansion, it’s essential to recognize the critical role that FMAP plays in sustaining our healthcare system and supporting our state’s economy. Any changes to the FMAP rate must be carefully evaluated to ensure that we do not undermine the progress we have made in expanding access to care and addressing the opioid crisis.

Beyond the immediate impact on healthcare services, changes to FMAP could also have broader economic implications for Ohio. Medicaid represents about 4% of the state’s GDP, playing a vital role in supporting jobs and economic activity. If just 1% of that GDP were suddenly eliminated due to a cut in federal or state funding, the consequences could be severe. A sudden reduction in Medicaid funding could lead to job losses in the healthcare sector, reduced economic activity, reduced labor force participation, and increased financial strain on state and local governments. The ripple effects would be felt across the economy, impacting not only healthcare providers but also businesses and communities that rely on the stability and support provided by Medicaid as well as the budgetary stability it provides to Ohio’s process.

A Closer Look at Gubernatorial Healthcare Priorities: 2025 State of the State Address Overview

This week, our In Focus section examines governors’ healthcare priorities from their 2025 State of the State addresses. This article highlights common themes in addresses delivered between January 6, 2025, and January 16, 2025, and delves into specific proposals in Georgia, Iowa, New York, and Oregon, as analyzed in the Health Management Associates (HMA), Information Services (HMAIS) interim report, 2025 State of the State Overview.

State of the States in the Current Environment

Governors use their State of the State addresses to outline their priorities for the year, giving insight into the agendas and initiatives that their executive branches may pursue independently or in collaboration with their state legislature. These priorities often are informed by the status of the state’s budget, with some governors advancing healthcare proposals that will address budget deficits and others seeking to invest in services and workforce initiatives.

Monitoring governors’ policy priorities and initiatives is especially important in 2025 given the changing federal landscape. The transition in both the administration and Congress will require state leaders to carefully consider the risks and opportunities. As detailed below, governors’ responses will unfold differently across states and markets.

Common Threads

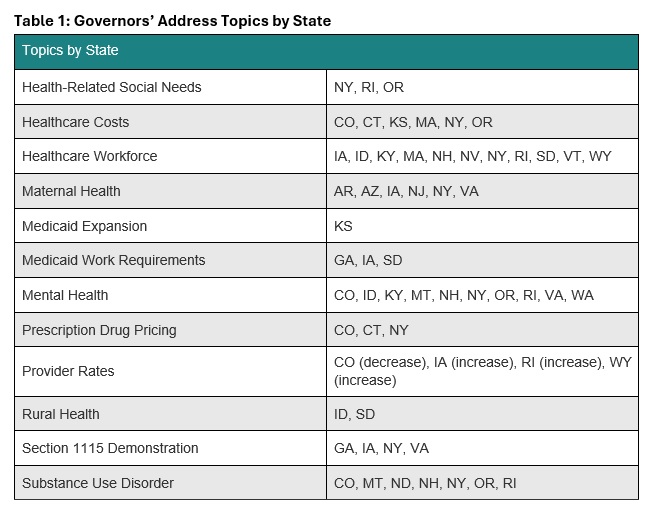
In all, 24 governors delivered a State of the State Address between January 6, 2025, and January 16, 2025. Many gubernatorial leaders have similar areas of priority and concern, with some continuing multiyear initiatives to address unmet behavioral health needs and control healthcare costs. Table 1 identifies the themes emerging from the first group of addresses.

Governors' Address Topics by State

Governors also are considering possible policy changes under the new Trump Administration. For example, some governors reported that their state is looking to strengthen or add Medicaid work requirements to their programs, resuming initiatives that were initially pursued during the first Trump Administration. Though not directly related to healthcare, governors’ decisions to mirror President Trump’s Department of Government Efficiency, with Iowa as an example, could indirectly affect local programs and markets. Other states are considering the implications of possible changes to federal Medicaid funding. A deeper look into the priorities in Georgia, Iowa, New York, and Oregon follows.

Georgia

Gov. Brian Kemp delivered Georgia’s State of the State address on January 16, 2025, during which he focused his healthcare remarks on the state’s Pathways to Coverage Section 1115 demonstration. Georgia’s waiver extends Medicaid coverage to able-bodied adults who earn up to the federal poverty level if they meet certain work requirements. The governor emphasized that he intends to work with the Trump Administration to further advance innovative approaches to healthcare access.

Governor Kemp stated that his administration is making it easier to apply for Medicaid coverage and will submit an amendment to the Centers for Medicare & Medicaid Services (CMS) that would extend the Pathways demonstration for five years beyond the current expiration date of September 30, 2025. The state plans to request several changes to the demonstration, including:

  • Changing the reporting requirements for qualified work activities
  • Adding more activities that qualify for program eligibility
  • Adding a retroactive coverage policy
  • Removing premiums and Member Reports Accounts

The governor’s proposed fiscal year (FY) 2026 budget includes $324 million to fully fund projected Medicaid enrollment and utilization growth and $36 million in additional support for pharmacy benefits, including recently approved gene therapy treatments for sickle cell disease.

Iowa

Iowa Gov. Kim Reynolds delivered the Condition of the State Address on January 14, 2025, during which she called for increased Medicaid reimbursement rates for OB/GYNs and primary care physicians who provide care to people with complex pregnancy cases, as well as certified nurse midwives. The governor also said she was in favor of adding doula services as a covered Medicaid benefit. Governor Reynolds is one of several governors who have announced plans to pursue a Section 1115 demonstration for Medicaid work requirements for able-bodied adults.

Governor Reynolds’s proposed FY 2026 budget includes investing $642,000 in newly unbundled Medicaid maternal rates, and more than double investments in five existing state healthcare loan repayment programs. The governor also proposes to establish a Medicaid Graduate Medical Education enhanced payment to draw down more than $150 million in federal dollars for more residency spots in Iowa’s teaching hospitals.

New York

New York Gov. Kathy Hochul delivered her State of the State Address on January 14, 2025, at which time she also released a State of the State Book. Addressing behavioral health is one of her chief priorities, and proposals include:

  • Allowing more involuntary commitments for people with severe mental illness
  • Developing programs to support youth mental health through after school programs
  • Expanding peer support programs
  • Improving the diagnostic process for children with complex needs
  • Supporting mental wellness in historically marginalized neighborhoods
  • Expanding Mobile Medication Units to bring opioid treatments to underserved areas

Governor Hochul intends to expand support for the state’s healthcare safety net. This part of her agenda would provide financial assistance to struggling medical facilities and hospitals through expansion of the state’s Safety Net Transformation Program and participation in the US Food and Drug Administration’s program that allows states to import lower-cost drugs from Canada.

The governor’s proposed $252 billion budget for FY 2026 would allocate $35.4 billion for the state Health Department’s Medicaid budget—a 14 percent increase from last year. Governor Hochul plans to offset some of the spending hike with revenue from the newly approved managed care organization tax, which is expected to raise $3.7 billion to help balance the state budget over three years.

Oregon

Gov. Tina Kotek delivered Oregon’s 2025 State of the State Address on January 13, 2025. The governor has a significant focus on mental health and substance use disorder treatment, as well as housing as an HRSN. Governor Kotek wants to strengthen the behavioral health system and proposed adding new treatment beds, increasing treatment capacity, eliminating backlogs at the state’s health licensing boards to improve access to qualified counselors, improving the provider pipeline, and increasing worker retention. During her speech, the governor also called for improved frontend care coordination to decrease the overflow of people at the Oregon State Hospital.

In addition, the governor intends to work toward improving care for the civil commitment population (i.e., people who are involuntarily detained in a psychiatric hospital) by dedicating permanent supportive housing funds to expanded residences with onsite services. Governor Kotek has directed her team to develop a new intensive permanent supportive housing model to more effectively support people with serious mental health needs.

Governor Kotek’s proposed budget for the 2025−2027 biennium includes $39.6 billion for the Oregon Health Authority, representing a 10.4 percent increase from the approved budget for 2023−2025. This budget includes $29.6 billion for the state Medicaid program and $1.6 billion for the Behavioral Health Division, in addition to $732.4 million for the division from the General Fund.

Connect With Us

HMAIS has prepared a comprehensive report summarizing each State of the State Address, which is available to HMAIS subscribers. The report also examines proposed budgets, highlighting key financial commitments and allocations that underscore these priorities for the upcoming year. The first iteration of the report covers AR, AZ, CO, CT, GA, IA, ID, KS, KY, MA, MT, ND, NE, NH, NJ, NV, NY, OR, RI, SD, VA, VT, WA, and WY. The document will be updated periodically as speeches occur.

Contact our experts below for more information about the report or to connect with one of HMA’s state policy and market experts.

Medicaid Managed Care Spending in 2017

This week, our In Focus section reviews Medicaid spending data collected in the annual CMS-64 Medicaid expenditure report. After submitting a freedom of information act request to CMS, we have received a draft version of the CMS-64 report that is based on preliminary estimates of Medicaid spending by state for federal fiscal year (FFY) 2017.  The final version of the report will be completed by the end of 2018 and posted to the CMS website at that time.  Based on the preliminary estimates, Medicaid expenditures on medical services across all 50 states and 6 territories in FFY 2017 exceeded $571 billion, with over half of all spending now flowing through Medicaid managed care programs. In addition, total Medicaid spending on administrative services was $27.8 billion, bringing total program expenditures to just under $600 billion.

Total Medicaid Managed Care Spending

Total Medicaid managed care spending (including the federal and state share) in FFY 2017 across all 50 states and 6 territories was $297 billion, up from $271 billion in FFY 2016. This figure includes spending on comprehensive risk-based managed care programs as well as prepaid inpatient health plans (PIHPs) and prepaid ambulatory health plans (PAHPs). PIHPs and PAHPs refer to non-comprehensive prepaid health plans that provide only certain services, such as dental services or behavioral health care. Fee-based programs such as primary care case management (PCCM) models are also counted in this total. However, comprehensive risk-based managed care organizations (MCOs) account for 95 percent of the total. Below we highlight some key observations:

  • Total Medicaid managed care spending grew 9.5 percent in FFY 2017, the lowest year-over-year growth rate since at least FFY 2007.
  • This slowing of spending growth, down from a peak of 31.4 percent in FFY 2015, is due in large part to fewer states expanding Medicaid under the Affordable Care Act (ACA).
  • In dollar terms, the increase from FFY 2016 to FFY 2017 was $25.8 billion compared to $32.7 billion from FFY 2015 to FFY 2016.
  • Medicaid managed care spending has increased at a 16.9 percent compounded annual growth rate (CAGR) since FFY 2007, compared to 6.1 percent growth in total Medicaid spending.
  • Medicaid managed care spending represented 51.9 percent of total Medicaid spending in FFY 2017, exceeding half of total Medicaid medical services expenditures for the first time. Compared to FFY 2016, the penetration rate increased by 2.8 percentage points, the smallest annual increase since FFY 2011.

Medicaid MCO Expenditures as a Percentage of Total Medicaid Expenditures FFY 2007-2017 ($M)

Medicaid expenditures

Source: CMS-64

The data breaks down the state and federal share of Medicaid expenditures, which illustrates the impact that the Medicaid expansion, which was initially 100 percent federally funded in the states where it was implemented, has had on the sources of funding.

As the table below indicates, 61.6 percent of FFY 2017 spending was contributed by federal sources, which is 4.2 percentage points higher than the pre-Medicaid expansion share in FFY 2013, but 1.6 percentage points lower than FFY 2016 due to the matching rate reduction for Medicaid expansion enrollees from 100 percent to 95 percent.

Federal vs. States Share of Medicaid Expenditures, FFY 2012-2017

Federal vs. State Medicaid expenditures

Source: CMS-64

State-specific Growth Trends

Forty-five states and territories report MCO spending on the CMS-64 report of which five states (Alabama, Idaho, North Carolina, Oklahoma and North Dakota) utilize a PCCM and/or PIHP/PAHP model exclusively. Of the remaining 40 states and territories that contract with risk-based MCOs, average spending in FFY 2017 increased 10.3 percent. On a percentage basis, Iowa experienced the highest year-over-year growth in Medicaid managed care spending for the second consecutive year at 88 percent, which was attributable to the continuing roll-out of its managed care program that began in April 2016. Louisiana, Nebraska and New York all saw Medicaid managed care spending growth of more than 40 percent.

The chart below provides additional detail on Medicaid managed care spending growth in states with risk-based managed care programs in FFY 2017. Interestingly, six states reported year over year declines in spending compared to two in FFY 2016.

Medicaid Managed Care Spending Growth on a Percentage Basis by State FFY 2016-17

Click to view graph in April 11, 2018 Weekly Roundup

Source: CMS-64

*Note: Not all states are included in the table due to incomplete data sets

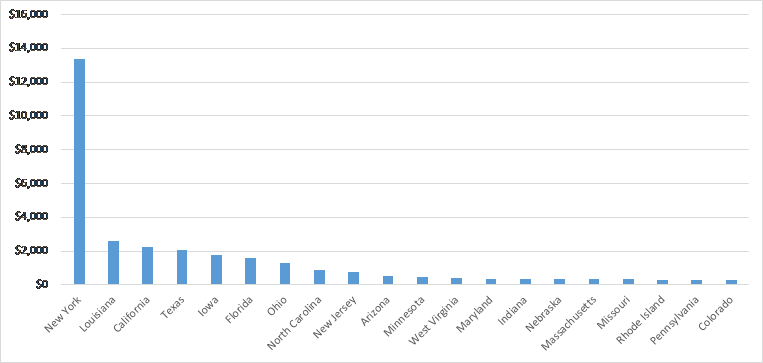
Looking at year-over-year spending growth in dollar terms, New York experienced the largest increase in Medicaid managed care spending by far at over $13 billion.  Other states with significant year-over-year spending increases in dollar terms included Lousiana ($2.6 billion), California ($2.2 billion) and Texas ($2.0 billion). All other states saw year-over-year spending growth of less than $2 billion. The chart below illustrates the year over year change in spending across the twenty states with the greatest increases.

Medicaid Managed Care Spending Growth on a Dollar Basis by State (Top Twenty States) FFY 2016-17 ($M)

Medicaid spending growth by state

Source: CMS-64

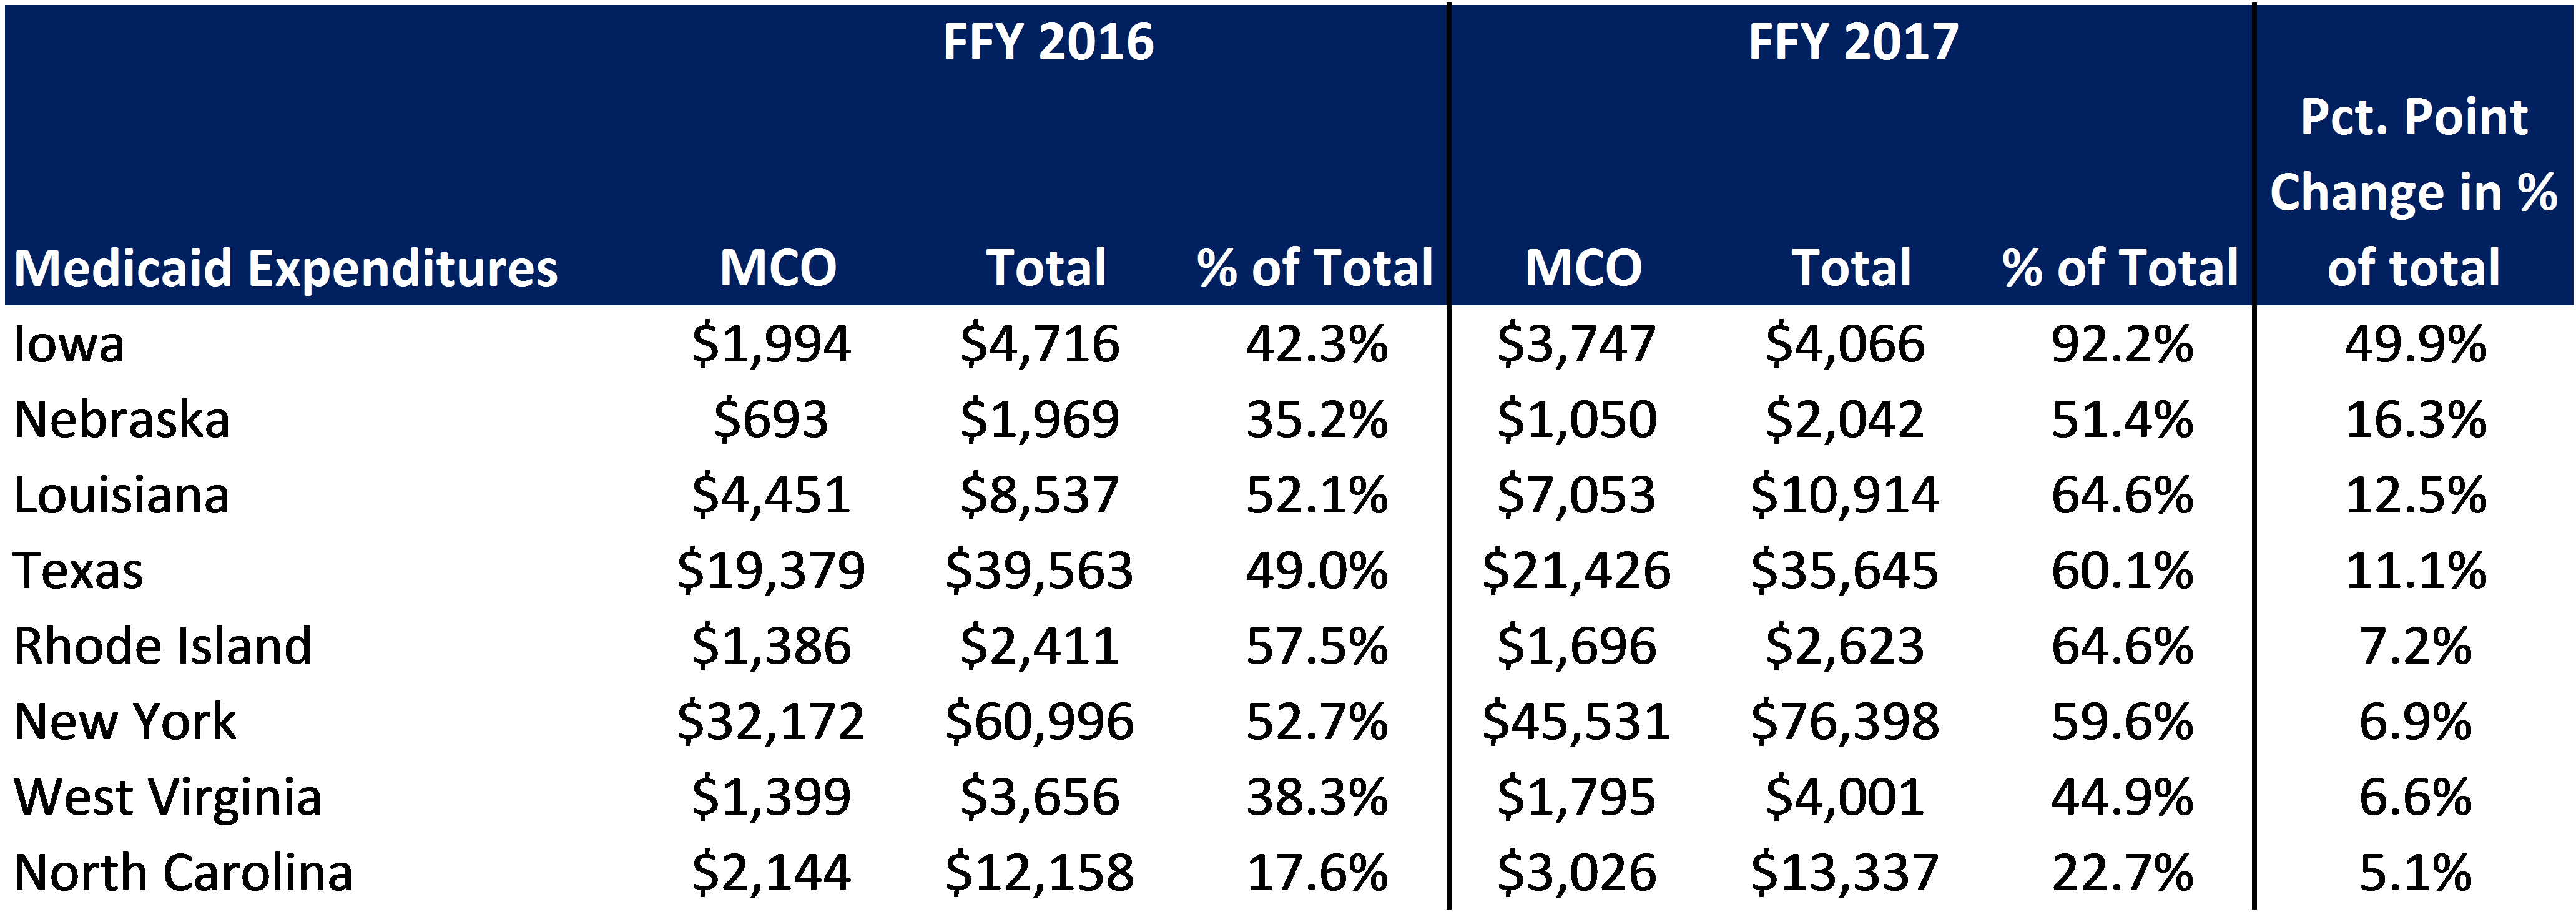
The percentage of Medicaid expenditures directed through risk-based Medicaid MCOs increased by more than 5 percentage points in eight states from FFY 2016 to FFY 2017. The managed care spending penetration rate rose 16.3 percentage points in Nebraska, and 12.5 percentage points in Louisiana.

Medicaid MCO Expenditures as a Percentage of Total Medicaid Expenditures in States with a 5 percent or Greater Increase From FFY 2016 to FFY 2017 ($M)

Medicaid expenditures by percentage

Source: CMS-64

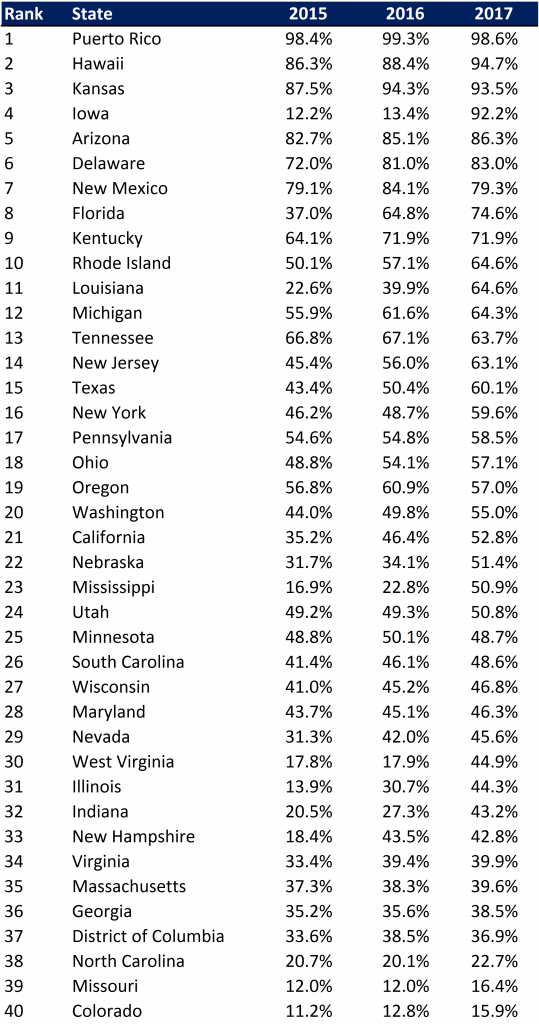
The table below ranks the 40 states with risk-based comprehensive Medicaid managed care programs by the percentage of total Medicaid spending that is through Medicaid MCOs. Puerto Rico reported the highest such percentage at 98.6 percent, followed by Hawaii at 94.7 percent and Kansas at 93.5 percent. Iowa is fourth on the list having increased its Medicaid managed care spending penetration rate from 13.4% to 92.2% over the last two years.

We note that in many states, there are certain payment mechanisms which may never be directed through managed care such as supplemental funding sources for institutional providers and spending on retroactively eligible beneficiaries. Thus, the maximum achievable penetration rate in each state will vary and may be below that achieved in other states. Nevertheless, we note that there are a few large states where the penetration rates are currently below two-thirds of total spending but where they have expanded their Medicaid managed care programs recently including Pennsylvania and Virginia. Accordingly, we expect that in FFY 2017 we will see continued growth in Medicaid MCO penetration, though likely at a more moderate pace.

Medicaid MCO Expenditures as a Percent of Total Medicaid Expenditures, FFY 2015-2017

Total Medicaid expenditures

Source: CMS-64

Non-MCO Expenditures

Despite the rapid growth in Medicaid managed care over the last ten years, program spending still represented just over half of total Medicaid expenditures in FFY 2017. So where is the remaining FFS spending (approximately $275 billion) going? First, as noted above, there are many states/territories with Medicaid managed care programs where certain beneficiaries or services are carved-out of the program, and these are typically associated with high-cost populations. The total amount of non-MCO spending in these 40 states in FFY 2017 was around $235 billion. If we were to assume for the sake of argument that “full penetration” was 85 percent of total Medicaid spending, then we estimate that an additional $200 billion in current FFS spending could shift to a managed care model just in the states that already employ managed care for a subset of services and/or beneficiaries.

Next, there are 16 states/territories that did not utilize a comprehensive risk-based managed care model in FFY 2017. One of these states, North Carolina, is planning to implement such a model in the next several years. In general, the 16 states/territories that do not utilize managed care today are smaller states, North Carolina being the largest at $13 billion of Medicaid spending in FFY 2017. Total Medicaid spending across all 16 non-managed care states was $34.7 billion. The 16 states/territories that did not employ a risk-based comprehensive Medicaid managed care model in FFY 2017 were Alabama, Alaska, American Samoa, Arkansas, Connecticut, Guam, Idaho, Maine, Montana, Northern Mariana Islands, North Dakota, North Carolina, Oklahoma, South Dakota, Vermont and Virgin Islands.

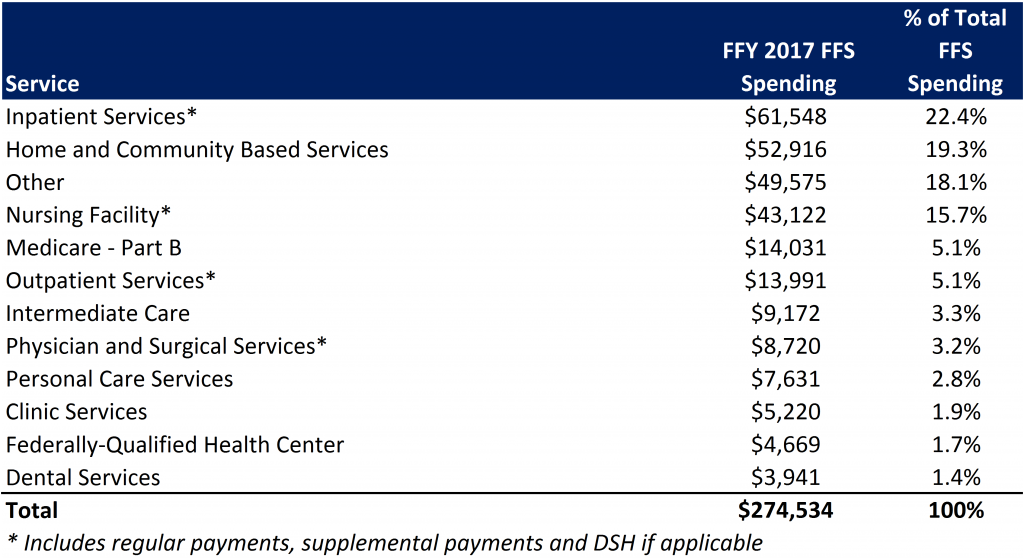
In terms of spending by service line, the largest remaining fee-for-service (FFS) category is inpatient services, at $61 billion or 22.4 percent of FFS spending. This amount is split fairly evenly between regular FFS payments (53 percent of total) and supplemental/Disproporate Share Hospital (DSH) payments (47 percent). Measured as a whole, however, we estimate long term care services and supports (including nursing facility, waiver and other home and community based services) represent the largest FFS funding category.

Fee for Service Medicaid Expenditures by Service Line, FFY 2017

Medicaid service line expenditures

Source: CMS-64

Finally, we note that while the CMS-64 report provides valuable detail by service line for all FFS expenditures, it does not capture how spending directed to Medicaid MCOs is allocated by category of service. As such, it is not possible to calculate total spending by service line, a challenge that will only intensify as more spending runs through MCOs.

Ready to talk?