This week, our In Focus section reviews recent Medicaid enrollment trends in capitated, risk-based managed care in 33 states.[1] Many state Medicaid agencies post monthly enrollment figures by health plan for their Medicaid managed care population to their websites. This data allows for the timeliest analysis of enrollment trends across states and managed care organizations. All 33 states highlighted in this review have released monthly Medicaid managed care enrollment data into the fourth quarter (Q4) of 2020. This report reflects the most recent data posted. HMA has made the following observations related to the enrollment data shown on Table 1 (below):
- The 33 states in this report account for an estimated 60 million Medicaid managed care enrollees as of December 2020. Based on HMA estimates of MCO enrollment in states not covered in this report, we believe that, nationwide, Medicaid MCO enrollment is likely over 63 million in 2020. As such, the enrollment data across these 33 states represents approximately 95 percent of all Medicaid MCO enrollment.
- Oklahoma could add approximately 742,000 Medicaid managed care lives when it transitions from fee-for-service in October 2021. North Carolina is also on track to shift to managed care in July 2021. Currently there are 2.3 million Medicaid members in the state.
- States with managed care that do not publish monthly enrollment reports are Delaware, Colorado, Massachusetts, New Hampshire, and Rhode Island.
- Across the 33 states tracked in this report, Medicaid managed care enrollment is up 15.8 percent year-over-year as of December 2020.
- All states saw increases in enrollment in December 2020, compared to previous year, due to the high gains from the COVID-19 pandemic.
- Twenty-three of the 33 states – Arizona, California, District of Columbia, Hawaii, Illinois, Indiana, Iowa, Kentucky, Louisiana, Maryland, Michigan, Minnesota, Nevada, New Jersey, New Mexico, New York, Ohio, Oregon, Pennsylvania, Utah, Virginia, Washington, and West Virginia – expanded Medicaid under the Affordable Care Act and have seen increased Medicaid managed care enrollment since expansion.
- The 23 expansion states listed above have seen net Medicaid managed care enrollment increase by 6 million members, or 15.6 percent, in the past year, to 44.9 million members at the end of Q4 2020.
- Missouri is expected to begin implementing its voter-approved Medicaid expansion by July 2021.
Table 1 – Monthly MCO Enrollment by State – July 2020 through December 2020
| Jul-20 | Aug-20 | Sep-20 | Oct-20 | Nov-20 | Dec-20 | |
| Arizona | 1,713,828 | 1,735,099 | 1,758,860 | 1,774,121 | 1,794,442 | 1,811,778 |
| +/- m/m | 21,823 | 21,271 | 23,761 | 15,261 | 20,321 | 17,336 |
| % y/y | 8.2% | 8.9% | 10.0% | 10.8% | 12.5% | 13.7% |
| California | 10,673,867 | 10,796,391 | 10,944,482 | 11,054,638 | 11,149,906 | 11,246,744 |
| +/- m/m | 107,716 | 122,524 | 148,091 | 110,156 | 95,268 | 96,838 |
| % y/y | 2.5% | 3.9% | 5.6% | 6.6% | 7.9% | 9.5% |
| D.C. | 193,735 | 197,854 | 200,065 | 219,119 | 220,325 | 221,879 |
| +/- m/m | 3,004 | 4,119 | 2,211 | 19,054 | 1,206 | 1,554 |
| % y/y | N/A | N/A | N/A | N/A | N/A | 15.0% |
| Florida | 3,474,483 | 3,523,695 | 3,572,363 | 3,627,647 | 3,659,834 | 3,710,315 |
| +/- m/m | 51,184 | 49,212 | 48,668 | 55,284 | 32,187 | 50,481 |
| % y/y | 9.3% | 10.9% | 12.8% | 14.6% | 16.2% | 18.0% |
| Georgia | 1,556,904 | 1,581,426 | 1,607,744 | 1,633,920 | 1,655,759 | 1,674,474 |
| +/- m/m | 57,813 | 24,522 | 26,318 | 26,176 | 21,839 | 18,715 |
| % y/y | 12.1% | 14.0% | 15.3% | 17.2% | 19.0% | 22.7% |
| Hawaii | 367,877 | 373,185 | 378,100 | |||
| +/- m/m | 5,965 | 5,308 | 4,915 | N/A | N/A | N/A |
| % y/y | 8.1% | 11.4% | 10.8% | |||
| Illinois | 2,453,608 | 2,498,788 | 2,547,855 | 2,576,344 | 2,597,213 | |
| +/- m/m | 144,842 | 45,180 | 49,067 | 28,489 | 20,869 | N/A |
| % y/y | 12.3% | 14.0% | 16.7% | 17.6% | 19.0% | |
| Indiana | 1,299,847 | 1,321,575 | 1,344,850 | 1,372,852 | 1,399,810 | 1,430,281 |
| +/- m/m | 27,408 | 21,728 | 23,275 | 28,002 | 26,958 | 30,471 |
| % y/y | 17.7% | 19.5% | 21.4% | 23.6% | 26.3% | 28.9% |
| Iowa | 678,556 | 686,939 | 694,076 | 701,342 | 708,174 | 714,499 |
| +/- m/m | 6,111 | 8,383 | 7,137 | 7,266 | 6,832 | 6,325 |
| % y/y | 5.1% | 7.6% | 8.9% | 10.0% | 11.3% | 12.0% |
| Kansas | 413,181 | 425,437 | ||||
| +/- m/m | N/A | N/A | N/A | N/A | N/A | N/A |
| % y/y | 10.5% | |||||
| Kentucky | 1,280,191 | 1,290,322 | 1,305,929 | 1,313,796 | 1,311,310 | 1,342,423 |
| +/- m/m | 13,741 | 10,131 | 15,607 | 7,867 | (2,486) | 31,113 |
| % y/y | 4.7% | 5.1% | 7.2% | 8.1% | 9.1% | 13.0% |
| Louisiana | 1,587,385 | 1,610,360 | 1,627,747 | 1,640,704 | 1,663,714 | 1,651,321 |
| +/- m/m | N/A | 22,975 | 17,387 | 12,957 | 23,010 | (12,393) |
| % y/y | 11.4% | N/A | N/A | 9.6% | N/A | 11.7% |
| Maryland | 1,269,896 | 1,275,322 | 1,289,028 | 1,304,143 | 1,314,379 | 1,328,268 |
| +/- m/m | 16,173 | 5,426 | 13,706 | 15,115 | 10,236 | 13,889 |
| % y/y | 5.8% | 6.0% | 7.1% | 8.2% | 9.2% | 11.4% |
| Michigan | 1,967,357 | 1,994,191 | 2,014,396 | 2,044,001 | 2,069,929 | 2,082,511 |
| +/- m/m | 45,971 | 26,834 | 20,205 | 29,605 | 25,928 | 12,582 |
| % y/y | 11.7% | 13.6% | 13.9% | 15.4% | 16.7% | 16.4% |
| Minnesota | 1,029,588 | 1,045,127 | 1,057,634 | 1,070,666 | 1,082,204 | 1,090,954 |
| +/- m/m | 17,919 | 15,539 | 12,507 | 13,032 | 11,538 | 8,750 |
| % y/y | 10.8% | 12.5% | 13.7% | 14.9% | 16.6% | 18.7% |
| Mississippi | 450,665 | 459,511 | 462,070 | 466,000 | 472,821 | 475,636 |
| +/- m/m | 5,762 | 8,846 | 2,559 | 3,930 | 6,821 | 2,815 |
| % y/y | 3.4% | 6.1% | 6.5% | 7.6% | 8.5% | 8.6% |
| Missouri | 688,684 | 704,631 | 719,209 | 734,621 | 745,640 | 756,461 |
| +/- m/m | 31,192 | 15,947 | 14,578 | 15,412 | 11,019 | 10,821 |
| % y/y | 14.9% | 22.6% | 24.1% | 28.4% | 27.9% | 30.1% |
| Nebraska | 249,260 | 253,514 | 257,589 | 269,440 | 277,790 | 285,354 |
| +/- m/m | 3,751 | 4,254 | 4,075 | 11,851 | 8,350 | 7,564 |
| % y/y | 9.0% | 10.5% | 11.6% | 17.2% | 20.0% | 23.9% |
| Nevada | 530,997 | 543,736 | 553,760 | 566,407 | 577,318 | 581,945 |
| +/- m/m | 11,492 | 12,739 | 10,024 | 12,647 | 10,911 | 4,627 |
| % y/y | 14.4% | 15.9% | 19.1% | 21.8% | 23.6% | 25.8% |
| New Jersey | 1,730,775 | 1,753,441 | 1,782,267 | 1,804,720 | 1,826,373 | 1,837,833 |
| +/- m/m | N/A | 22,666 | 28,826 | 22,453 | 21,653 | 11,460 |
| % y/y | 6.7% | 9.1% | 10.5% | 12.3% | 14.0% | 15.8% |
| New Mexico | 713,388 | 720,947 | 727,421 | 733,381 | 739,327 | 748,383 |
| +/- m/m | 8,209 | 7,559 | 6,474 | 5,960 | 5,946 | 9,056 |
| % y/y | 7.8% | 8.6% | 9.2% | 9.9% | 10.7% | 11.6% |
| New York | 5,013,007 | 5,076,657 | 5,169,895 | 5,248,850 | 5,308,931 | 5,378,218 |
| +/- m/m | 83,527 | 63,650 | 93,238 | 78,955 | 60,081 | 69,287 |
| % y/y | 6.5% | 8.2% | 10.3% | 12.5% | 14.5% | 16.5% |
| Ohio | 2,710,581 | 2,734,018 | 2,761,497 | 2,775,535 | 2,792,865 | 2,822,896 |
| +/- m/m | 29,036 | 23,437 | 27,479 | 14,038 | 17,330 | 30,031 |
| % y/y | 20.2% | 22.5% | 25.0% | 26.4% | 28.9% | 36.4% |
| Oregon | 973,749 | 981,809 | 995,807 | 1,006,104 | 1,014,119 | |
| +/- m/m | 10,236 | 8,060 | 13,998 | 10,297 | 8,015 | N/A |
| % y/y | 9.5% | 11.3% | 12.7% | 12.8% | 14.5% | |
| Pennsylvania | 2,404,996 | 2,434,275 | 2,461,326 | 2,489,219 | 2,517,302 | 2,541,504 |
| +/- m/m | 32,232 | 29,279 | 27,051 | 27,893 | 28,083 | 24,202 |
| % y/y | 6.3% | 8.0% | 9.5% | 10.9% | 12.6% | 14.0% |
| South Carolina | 865,457 | 878,183 | 889,047 | 899,577 | 912,678 | 922,891 |
| +/- m/m | 9,792 | 12,726 | 10,864 | 10,530 | 13,101 | 10,213 |
| % y/y | 6.6% | 8.8% | 9.2% | 10.6% | 12.6% | 13.8% |
| Tennessee | 1,464,487 | 1,480,466 | 1,493,081 | 1,503,839 | 1,513,581 | 1,526,031 |
| +/- m/m | 15,345 | 15,979 | 12,615 | 10,758 | 9,742 | 12,450 |
| % y/y | 3.2% | 4.3% | 4.9% | 6.0% | 6.9% | 8.0% |
| Texas | 4,468,464 | 4,618,921 | ||||
| +/- m/m | N/A | N/A | N/A | N/A | N/A | N/A |
| % y/y | 14.7% | |||||
| Utah | 288,545 | 296,195 | 304,944 | 312,773 | 320,747 | 327,744 |
| +/- m/m | 10,005 | 7,650 | 8,749 | 7,829 | 7,974 | 6,997 |
| % y/y | 25.7% | 29.3% | 34.1% | 38.6% | 42.5% | 46.4% |
| Virginia | 1,219,432 | 1,234,634 | 1,251,554 | 1,271,032 | 1,286,464 | 1,308,777 |
| +/- m/m | 19,791 | 15,202 | 16,920 | 19,478 | 15,432 | 22,313 |
| % y/y | 22.9% | |||||
| Washington | 1,608,050 | 1,627,391 | 1,646,862 | 1,662,652 | 1,677,523 | 1,701,943 |
| +/- m/m | 19,323 | 19,341 | 19,471 | 15,790 | 14,871 | 24,420 |
| % y/y | 0.0% | 0.0% | 12.2% | 0.0% | 0.0% | 11.8% |
| West Virginia | 429,336 | 434,426 | 437,061 | 442,849 | 447,625 | 463,057 |
| +/- m/m | 2,967 | 5,090 | 2,635 | 5,788 | 4,776 | 15,432 |
| % y/y | 10.8% | 12.1% | 13.5% | 14.9% | 16.0% | 20.3% |
| Wisconsin | 931,273 | 947,493 | 963,205 | 978,670 | 992,346 | 1,006,662 |
| +/- m/m | 16,989 | 16,220 | 15,712 | 15,465 | 13,676 | 14,316 |
| % y/y | 15.5% | 17.1% | 19.0% | 20.9% | 22.2% | 24.4% |
Note: In Table 1 above and the state tables below, “+/- m/m” refers to the enrollment change from the previous month. “% y/y” refers to the percentage change in enrollment from the same month in the previous year.
Below, we provide a state-specific analysis of recent enrollment trends in the states where HMA tracks data.
It is important to note the limitations of the data presented. First, not all states report the data at the same time during the month. Some of these figures reflect beginning-of-the-month totals, while others reflect an end-of-the-month snapshot. Second, in some cases the data is comprehensive in that it covers all state-sponsored health programs for which the state offers managed care; in other cases, the data reflects only a subset of the broader managed Medicaid population. This is the key limiting factor in comparing the data described below and figures reported by publicly traded Medicaid MCOs. Consequently, the data we review in Table 1 and throughout the In Focus section should be viewed as a sampling of enrollment trends across these states rather than a comprehensive comparison, which cannot be developed based on publicly available monthly enrollment data.
State-Specific Analysis
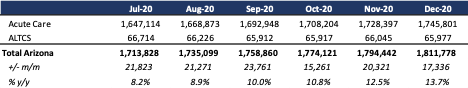
Arizona
Medicaid Expansion Status: Expanded January 1, 2014
Enrollment in Arizona’s two Medicaid managed care programs has grown to 1.8 million in December 2020, up 13.7 percent from December 2019.
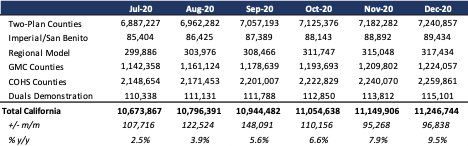
California
Medicaid Expansion Status: Expanded January 1, 2014
Medi-Cal managed care enrollment data shows an increase in December 2020, with managed care enrollment up approximately 97,000 members since December 2019. As of December 2020, enrollment in managed care is over 11.2 million.
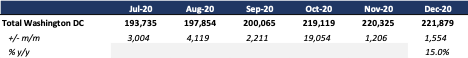
District of Columbia
Medicaid Expansion Status: Expanded January 1, 2014
Medicaid managed care enrollment was up 15 percent to approximately 222,000 in December 2020.
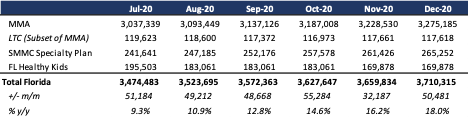
Florida
Medicaid Expansion Status: Not Expanded
Florida’s statewide Medicaid managed care program has seen an 18 percent rise in total covered lives over the last year to 3.7 million beneficiaries as of December 2020. (Note that the managed LTC enrollment figures listed below are a subset of the Managed Medical Assistance (MMA) enrollments and are included in the MMA number; they are not separately added to the total to avoid double counting).
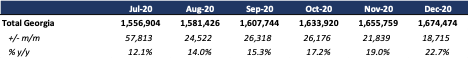
Georgia
Medicaid Expansion Status: Not Expanded
As of December 2020, Georgia’s Medicaid managed care program covered nearly 1.7 million members, up 22.7 percent from the previous year.
Hawaii
Medicaid Expansion Status: Expanded January 1, 2014
Through September 2020, enrollment in the Hawaii Medicaid managed care program stands at 378,100, up 10.8 percent from September 2019.

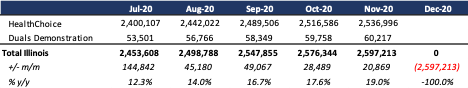
Illinois
Medicaid Expansion Status: Expanded January 1, 2014
Illinois enrollment across the state’s managed care programs was up 19 percent to 26 million as of November 2020.
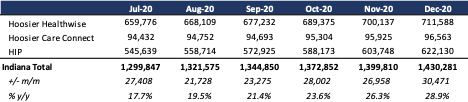
Indiana
Medicaid Expansion Status: Expanded in 2015 through HIP 2.0
As of December 2020, enrollment in Indiana’s managed care programs—Hoosier Healthwise, Hoosier Care Connect, and Healthy Indiana Program (HIP)—is over 1.4 million, up 28.9 percent from December 2019.
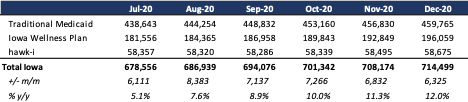
Iowa
Medicaid Expansion Status: Expanded January 1, 2014
Iowa launched its statewide Medicaid managed care program in April of 2016. Enrollment across all populations sits at 714,500 as of December 2020. Enrollment is up 12 percent from the previous year.
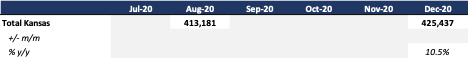
Kansas
Medicaid Expansion Status: Not Expanded
Kansas Medicaid managed care enrollment was over 425,000 as of December 2020, up 10.5 percent from the previous year.
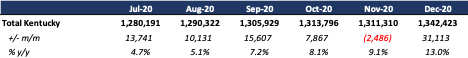
Kentucky
Medicaid Expansion Status: Expanded January 1, 2014
As of December 2020, Kentucky covered over 1.3 million beneficiaries in risk-based managed care. Total enrollment is up 13 percent from the prior year.
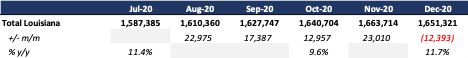
Louisiana
Medicaid Expansion Status: Expanded July 1, 2016
Medicaid managed care enrollment is nearly 1.7 million as of December 2020, up 11.7 percent from the previous year.
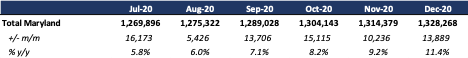
Maryland
Medicaid Expansion Status: Expanded January 1, 2014
Maryland’s Medicaid managed care program covered over 1.3 million lives as of December 2020.
Michigan
Medicaid Expansion Status: Expanded April 1, 2014
As of December 2020, Michigan’s Medicaid managed care is up 16.4 percent to over 2 million.
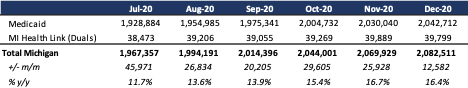
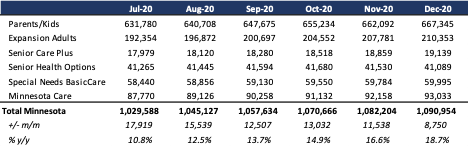
Minnesota
Medicaid Expansion Status: Expanded January 1, 2014
As of December 2020, enrollment across Minnesota’s multiple managed Medicaid programs sits at 1.1 million, up 18.7 percent from the prior year.
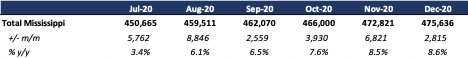
Mississippi
Medicaid Expansion Status: Not Expanded
MississippiCAN, the state’s Medicaid managed care program, had net enrollment declines between 2016 and 2018 and a flat showing in 2019. However, enrollment began to rise in 2020 due to COVID-19. Medicaid managed care membership is up 8.6 percent to 476,000 as of December 2020.
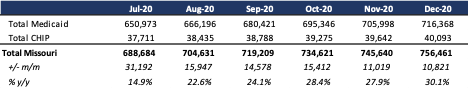
Missouri
Medicaid Expansion Status: Expected July 2021
Missouri managed care enrollment in the Medicaid and CHIP programs sits at 756,000 as of December 2020. Missouri is expected to begin implementing its voter-approved Medicaid expansion by July 2021.
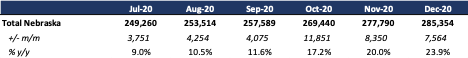
Nebraska
Medicaid Expansion Status: Expanded October 1, 2020
As of December 2020, the program enrolled 285,000 members, up 23.9 percent from the previous year.
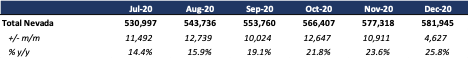
Nevada
Medicaid Expansion Status: Expanded January 1, 2014
Nevada’s Medicaid managed care enrollment was up 25.8 percent to nearly 582,000 as of December 2020.
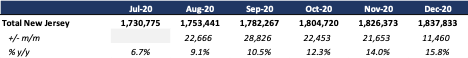
New Jersey
Medicaid Expansion Status: Expanded January 1, 2014
As of December 2020, enrollment was up 15.8 percent to over 1.8 million.
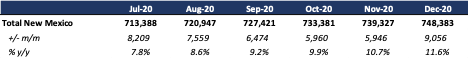
New Mexico
Medicaid Expansion Status: Expanded January 1, 2014
As of December 2020, New Mexico’s Centennial Care program covers over 748,000 members, up 11.6 percent from the previous year.
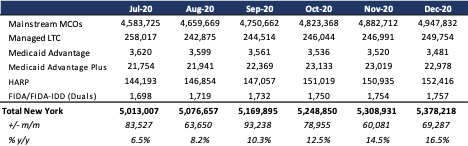
New York
Medicaid Expansion Status: Expanded January 1, 2014
New York’s Medicaid managed care programs collectively covered 5.4 million beneficiaries as of December 2020, a 16.5 percent increase from the previous year. New York phased out its Fully Integrated Duals Advantage (FIDA) Demonstration in December 2019 and moved all FIDA enrollees into that plan’s Medicaid Advantage Plus (MAP) plan. The FIDA-IDD program ended December 31, 2020.
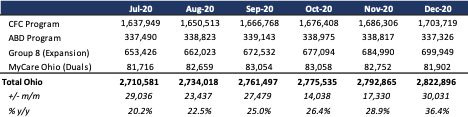
Ohio
Medicaid Expansion Status: Expanded January 1, 2014
As of December 2020, enrollment across all four Ohio Medicaid managed care programs was over 2.8 million, up 36.4 percent from the prior year.
Oregon
Medicaid Expansion Status: Expanded January 1, 2014
As of November 2020, enrollment in the Oregon Coordinated Care Organization (CCO) Medicaid managed care program is over 1 million. (This figure includes roughly 1,600 enrolled in managed care other than CCO).

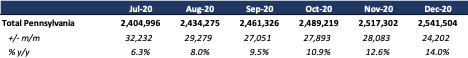
Pennsylvania
Medicaid Expansion Status: Expanded January 1, 2015
As of December 2020, Pennsylvania’s Medicaid managed care enrollment is over 2.5 million, up 14 percent in the past year.
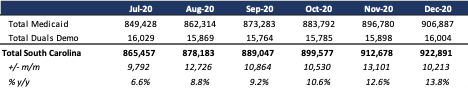
South Carolina
Medicaid Expansion Status: Not Expanded
South Carolina’s Medicaid managed care programs collectively enrolled nearly 923,000 members as of December 2020, which represents an increase of 13.8 percent in the past year.
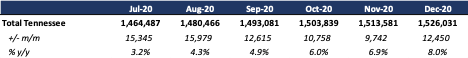
Tennessee
Medicaid Expansion Status: Not Expanded
As of December 2020, TennCare managed care enrollment totaled 1.5 million, up 8 percent from the prior year.
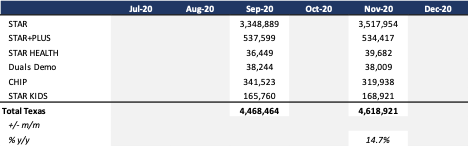
Texas
Medicaid Expansion Status: Not Expanded
Enrollment reporting out of Texas has been limited in the past year. As of November 2020, Texas managed care enrollment was over 4.6 million across the state’s six managed care programs, up 14.7 percent from November 2019.
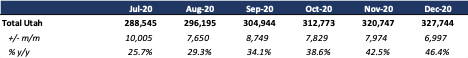
Utah
Medicaid Expansion Status: Expanded January 1, 2020
As of December 2020, Utah’s Medicaid managed care enrollment was nearly 328,000, up 46.4 percent from the previous year. The state implemented the Utah Medicaid Integrated Care (UMIC) program effective January 1, 2020. The program manages physical and behavioral benefits through integrated managed care plans in five counties. Adult Expansion Medicaid members in Davis, Salt Lake, Utah, Washington, and Weber counties are required to enroll in a UMIC plan.
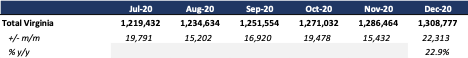
Virginia
Medicaid Expansion Status: January 1, 2019
Enrollment was up 22.9 percent in December 2020 to 1.3 million members.
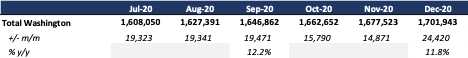
Washington
Medicaid Expansion Status: Expanded January 1, 2014
Washington’s Medicaid managed care enrollment increased 11.8 percent to 1.7 million as of December 2020, compared to December 2019.
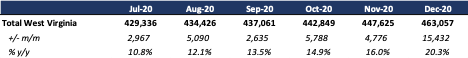
West Virginia
Medicaid Expansion Status: Expanded January 1, 2014
As of December 2020, West Virginia’s managed care program covered 463,000 members, up 20.3 percent year-over-year.
Wisconsin
Medicaid Expansion Status: Not Expanded
Across Wisconsin’s three managed care programs, December 2020 enrollment totaled 1 million, up 24.4 percent from the year before.

More Information Available from HMA Information Services
More detailed information on the Medicaid managed care landscape is available from HMA Information Services (HMAIS), which collects Medicaid enrollment data, health plan financials, and the latest on expansions, waivers, duals, ABD populations, long-term care, accountable care organizations, and patient-centered medical homes. HMAIS also includes a public documents library with copies of Medicaid RFPs, responses, model contracts, and scoring sheets.
HMA enhances this publicly available information with an overview of the structure of Medicaid in each state, as well as a proprietary HMA Medicaid Managed Care Opportunity Assessment.
[1] Arizona, California, District of Columbia, Florida, Georgia, Hawaii, Illinois, Indiana, Iowa, Kansas, Kentucky, Louisiana, Maryland, Michigan, Minnesota, Mississippi, Missouri, Nebraska, Nevada, New Jersey, New Mexico, New York, Ohio, Oregon, Pennsylvania, South Carolina, Tennessee, Texas, Utah, Virginia, Washington, West Virginia, Wisconsin.