This week, our In Focus section highlights findings from a Health Management Associates Information Services (HMAIS) analysis of the Centers for Medicare & Medicaid Services (CMS) preliminary CMS-64 Medicaid expenditure report for federal fiscal year (FFY) 2025. The data show total medical services expenditures reached $971.4 billion across all states and territories, up 6.9 percent from FFY 2024.
This CMS-64 spending detail provides important context as states prepare for their upcoming legislative sessions and begin implementing changes required under the 2025 budget reconciliation act (P.L. 119-21, OBBBA). Early fiscal and operational pressures will stem from changes to the Supplemental Nutrition Assistance Program (SNAP) and preparations for community engagement requirements for Affordable Care Act (ACA) Medicaid expansion enrollees. In subsequent years, pressures will intensify because of major changes to provider tax financing and new federal limits on state directed payments in 2027 and early 2028.
In this article, we provide a deeper review of Medicaid spending, including the federal-state financing split. As Medicaid agencies prepare for upcoming spring sessions and anticipate potential program changes under OBBBA, it is notable that nearly two-thirds of Medicaid directors report an at least fifty percent likelihood of a Medicaid budget shortfall in FFY 2026.
Growth and Drivers in Medicaid Managed Care Spending
The HMAIS analysis looks at CMS-64 preliminary estimates of Medicaid spending by state for FFY 2025. CMS tracks state expenditures through the automated Medicaid Budget and Expenditure System/State Children’s Health Insurance Budget and Expenditure System (MBES/CBES).
While enrollment decreased for most states following the COVID-19 public health emergency unwinding, states saw an uptick in expenditures due to increased state directed payments, greater utilization and sicker populations, higher drug costs, increased provider rates, and greater use of long-term services and supports and behavioral health.
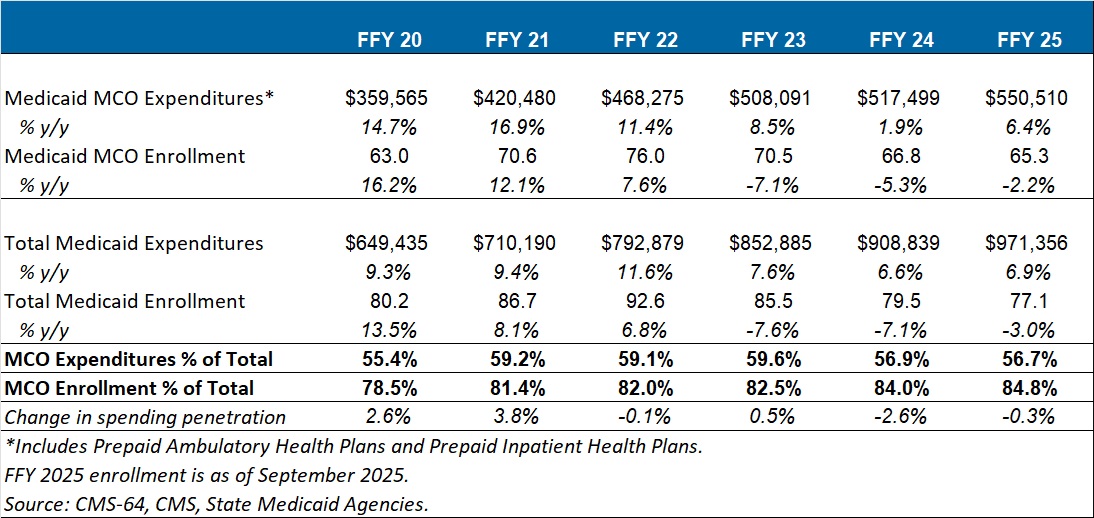
Key findings from HMAIS’ analysis (see Table 1), include:
- Total Medicaid managed care spending (federal and state share combined) reached $550.5 billion in FFY 2025, up from $517.5 billion in FFY 2024.
- This amount represents a 6.4 percent year-over-year increase from FFY 2024 to FFY 2025.
- Managed care accounted for 56.7 percent of total Medicaid spending in FFY 2025, down 0.3 percentage points from the previous year.
- The $33 billion increase from FFY 2024 to FFY 2025 exceeds the $9.4 billion increase seen the year prior, reflecting renewed growth following the unwinding transition period.
These figures include spending on comprehensive risk-based managed care organizations (MCOs), prepaid inpatient health plans (PIHPs), and prepaid ambulatory health plans (PAHPs). PIHPs and PAHPs refer to prepaid health plans that provide a subset of services, such as dental or behavioral health care. This total is exclusive of fee-based programs such as primary care case management models.
Table 1. Medicaid MCO Expenditures as a Percentage of Total Medicaid Expenditures, FFY 2020–2025 (in millions)
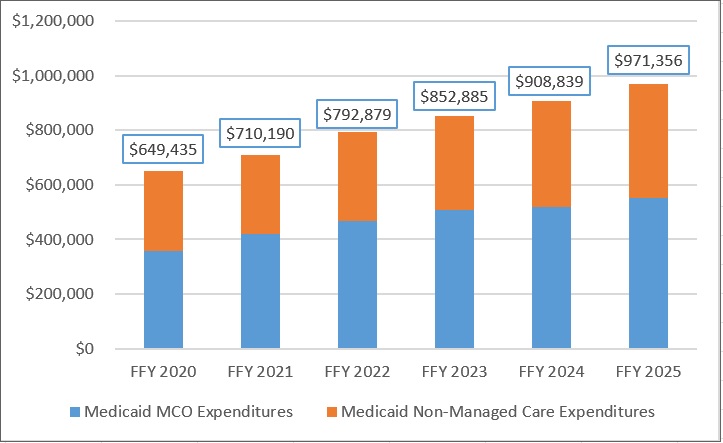
Annual Medicaid managed care expenditures have grown consistently with total Medicaid expenditures. After slower growth in FFY 2024—which aligned with the post-COVID-19 policy unwinding period when many states completed eligibility redeterminations—FFY 2025 again experienced an uptick in managed care growth (see Figure 1).
Figure 1. Total and MCO Medicaid Expenditures, FFY 2020–2025 ($M)
Federal versus State Share Spending
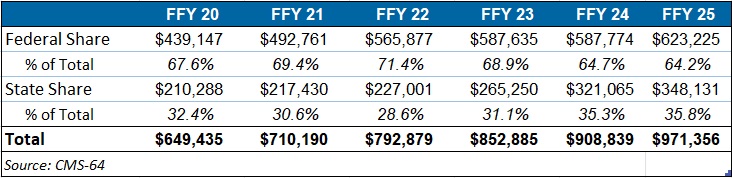
The preliminary FFY 2025 expenditure data provides a baseline before OBBBA’s changes are scheduled for implementation and as states continue to face Medicaid funding challenges. In FFY 2025, federal funding accounted for 64.2 percent of FFY 2025 spending, and non-federal matching funds accounted for 35.8 percent (see Table 2). Particularly later in 2027, 2028, and subsequent years, Medicaid expansion states stand to see disproportionally larger increases in their share of spending.
Table 2. Federal versus State Share of Medicaid Expenditures, FFY 2020–2025 (in millions)
T-MSIS Data Adds Detail to CMS-64 MCO Spending
To complement CMS-64 macro-spending trends, HMA developed a methodology allowing us to use Transformed Medicaid Statistical Information System (T-MSIS) data to approximate managed care spending by service category. Although T-MSIS enables more granular views (e.g., professional services, inpatient/outpatient hospital services, skilled nursing facilities (SNFs), HCBS, clinics, pharmaceuticals), the most recent dataset typically lags one to two years behind CMS-64 totals.
HMA’s analysis of the T-MSIS data shows that while managed care remains the dominant delivery system model for Medicaid, spending by provider types helps contextualize the CMS-64 report. Notably, the CMS-64 reports FFY25 data and our report below on T-MSIS disaggregation uses 2023 data. Although the T-MSIS and CMS-64 data are for different years, it still highlights the main components of the largest spending component of the CMS-64 with more recent data.
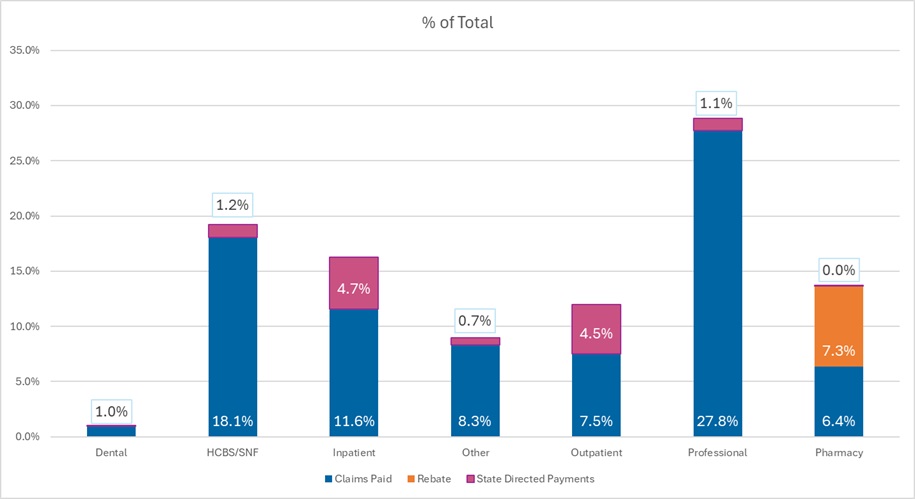
The 2023 T-MSIS analysis shows the following:
- Professional fees are the lead spending category, with nearly 30 percent of spending directed toward payments to physicians and other practitioners (e.g., physician assistants, nurse practitioners). Given that T-MSIS data are built around billing codes, services that traditionally may be considered part of a bundled rate (i.e., a large portion of physician services delivered in hospitals and clinics) are essentially unbundled and considered professional fees.
- Hospital spending (inpatient plus outpatient), SNF costs, and professional fees together account for close to 75 percent of spending in CY 2023.
Figure 2. T-MSIS Medicaid Spending by Service Category 2023 (MCO disaggregated plus FFS)
What to Watch
Because Medicaid is such a big part of state government spending, outlays for Medicaid will always be a focus and challenge for states. Upcoming state legislative sessions and OBBBA driven changes will begin in 2026 with SNAP pressures and major operational preparations for community engagement requirements for expansion states. Preparations for new limits on provider taxes and state directed payments will likely begin immediately, but the true impacts will occur in 2027 and early 2028. States will need to tailor their programs under funding constraints.
Connect with Us
HMAIS, a subscription-based tool that Health Management Associates offers, provides state-by-state analysis of the CMS-64 data, Medicaid managed care enrollment trends, and state budget reporting. For more information about an HMAIS subscription, contact Andrea Maresca and Alona Nenko. For details on T-MSIS data, contact Matt Powers and Shreyas Ramani.