
This week, our In Focus section highlights findings from the Centers for Medicare & Medicaid Services (CMS) preliminary CMS-64 Medicaid expenditure report for federal fiscal year (FFY) 2024. According to the preliminary estimates, Medicaid expenditures on medical services across all 50 states and six territories in FFY 2024 totaled $908.8 billion.
This figure provides important context and an initial baseline for tracking Medicaid spending trends following the enactment of H.R. 1, the One Big Beautiful Bill Act. According to the Congressional Budget Office’s preliminary analysis, H.R. 1 will reduce federal Medicaid and Children’s Health Insurance Program (CHIP) spending by approximately $1.02 trillion over the next decade (2025−2034)—a significant share of total Medicaid expenditures.
Total Medicaid Managed Care Spending
The following analysis is based on a Health Management Associates Information Services (HMAIS) analysis of the draft CMS-64 report. This report contains preliminary estimates of Medicaid spending by state for FFY 2024. CMS tracks state expenditures through the automated Medicaid Budget and Expenditure System/State Children’s Health Insurance Budget and Expenditure System (MBES/CBES). The CMS-64 form identifies annual expenditures through these systems.
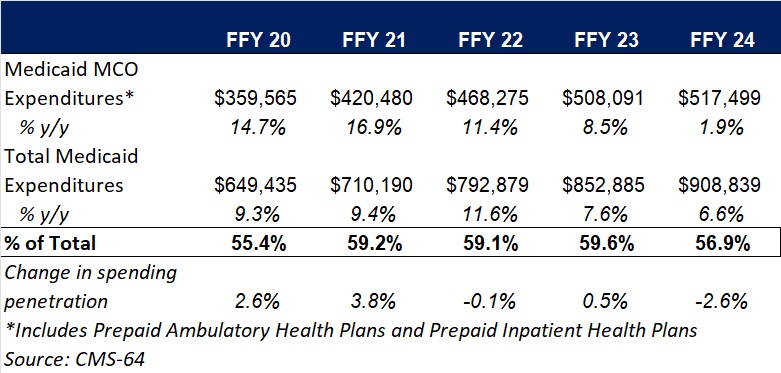
Key findings from HMAIS’ analysis, as also shown in Table 1, include:
- Total Medicaid managed care spending (federal and state share combined) reached $517.5 billion in FFY 2024, up from $508.1 billion in FFY 2023.
- This amount represents a 1.9 percent year-over-year increase from FFY 2023 to FFY 2024, a notable slowdown compared to the 8.5 percent growth observed in our analysis of year-over-year spending from FFY 2022 to FFY 2023.
- Managed care accounted for 56.9 percent of total Medicaid spending in FFY 2024, down 2.6 percentage points from the previous year.
- In terms of dollars, the increase in Medicaid managed care spending from FFY 2023 to FFY 2024 was $9.4 billion, compared with $39.8 billion from FFY 2022 to FFY 2023.
These figures include spending on comprehensive risk-based managed care organizations (MCOs), prepaid inpatient health plans (PIHPs), and prepaid ambulatory health plans (PAHPs). PIHPs and PAHPs refer to prepaid health plans that provide only certain services, such as dental or behavioral health care. Fee-based programs, such as primary care case management models, are not included in this total.
Table 1. Medicaid MCO Expenditures as a Percentage of Total Medicaid Expenditures, FFY 2020−2024 ($M)
Medicaid Managed Care Spending Insights
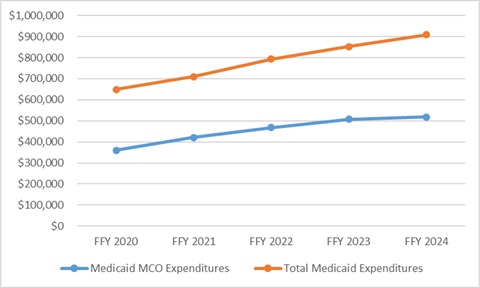
Medicaid managed care expenditures have grown consistently each year with total Medicaid expenditures. In FFY 2024, however, the growth in the share of managed care expenditures was notably lower than in the previous four years. The slower growth in managed care spending aligns with the post-COVID-19 policy unwinding period, during which many states completed eligibility redeterminations that had been paused during the public health emergency, driving historic enrollment increases (see Figure 1).
Figure 1. Total and MCO Medicaid Expenditures, FFY 2020−2024 ($M)
In addition, Health Management Associates (HMA) has access to data in the Transformed Medicaid Statistical Information System (T-MSIS) and has analyzed MCO spending in major categories of healthcare, including inpatient and outpatient hospital care, physician and other professional services, skilled nursing facilities (SNFs) and home and community-based services (HCBS), clinics, pharmaceuticals, and other services. Similarly, based on the CMS-64 data, in FFY 2024, the largest non-managed care spending categories included:
- HCBS: $108.8 billion
- Inpatient hospital services: $71.9 billion
- Nursing facilities: $46.3 billion
HMA’s analysis of the T-MSIS database shows that while managed care remains the dominant delivery system model for Medicaid, spending in certain categories, such as SNFs and professional services, is growing faster. This shift may explain the declining share of managed care in overall Medicaid expenditures, even as absolute spending remains high. Further details can be found on this webpage and this webpage as well.
Federal Versus State Spending
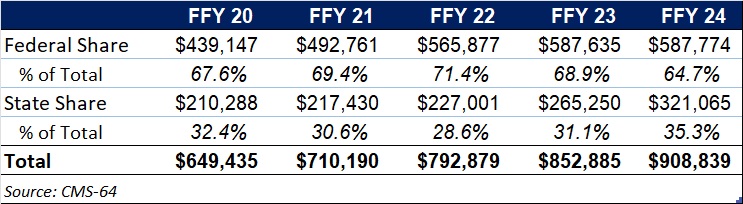
This year’s data reflect the phase-out of the temporary 6.2 percentage-point federal medical assistance percent increase under the Families First Coronavirus Response Act, which ended December 31, 2023. In FFY 2024, 64.7 percent of FFY 2024 spending came from federal sources (see Table 2).
Table 2. Federal versus State Share of Medicaid Expenditures, FFY 2020−2024 ($M)
What to Watch
Looking ahead, state Medicaid agencies will need to reassess financing strategies as total Medicaid federal funding declines because of H.R. 1 and other federal regulatory oversight and policy changes take effect. H.R. 1 includes provisions to gradually reduce allowable state provider tax rates from 6 percent to 3.5 percent by 2032, potentially requiring states to restructure financing or identify cost-saving measures.
CBO projections estimate that the Medicaid provisions in the bill will increase the number of uninsured individuals by an estimated 7.8 million by 2034.
Connect with Us
HMAIS, a subscription-based tool offered by HMA, provides detailed state by state analysis of the CMS-64 data and Medicaid managed care enrollment trends. For more information about the HMAIS subscription and access to the CMS-64 data, contact our experts below.