1307 Results found.

Pipeline Research and Policy Recommendations to Address New Innovative Therapies
THE CLIENT
Large national pharmaceutical manufacturer government affairs team focused on innovative therapies, including cell and gene therapies.
BACKGROUND
The client was looking for an experienced team who could assess the current pipeline of innovative therapies, examine current reimbursement policies to assess long-term compatibility with the adoption of innovative therapies and novel delivery mechanisms, and make policy recommendations to address any challenges identified through the process. HMA, The Moran Company, and Leavitt Partners, both HMA subsidiaries, were selected as the team with the needed expertise and capacity to create several deliverables. These deliverables were focused on the impact of the upcoming pipeline of certain innovative therapies on different payment systems, as well as working with the client’s team to develop and refine federal and state policy recommendations to address identified challenges.
APPROACH
Our collective team developed the following qualitative and quantitative analyses:
- Pipeline analysis of near-term innovative therapies
- Analysis of this pipeline’s interaction with current Medicare payment systems
- Site of services for delivery of therapies and movement across payment systems
- Overview of FDA oversight of cell and gene therapy
- Medicaid reimbursement and budgetary issues resulting from pipeline of therapies
- Payment system capacity issues analysis
- Development and refinement of policy program recommendations
Pipeline analysis. With the pipeline analysis, the team assessed the types of products and stage of development before undertaking research on characteristics of individual therapies potentially entering the market. Data on potential new products was then stratified to allow for further analysis of key characteristics, such as patient population, type of clinical treatment, acute and chronic use, sites of service, and type of effect of the treatment.
Payment system impacts. The payment analyses included a combination of quantitative and qualitative sources to project the impacts of the pipeline on Medicare and Medicaid, as well as other impacts on payment system capacity.
Policy recommendations. After completing analyses on the different areas of payment impacts resulting from the pipeline of potential therapies, the team developed more than two dozen policy recommendations that could prepare, and further improve, existing payment systems for the pipeline of expected therapies. The team also identified potential strategies to educate policymakers and advance policies. Recommendations included policies related to Medicaid, Medicare, and value-based payments.
RESULTS
The project equipped the client with a holistic understanding of future potential impacts and actions to address challenges in a detailed pipeline analysis of innovative therapies.
Laying the Foundation for Modernizing Indiana’s Public Health System
THE CLIENT
The Indiana Department of Health.
BACKGROUND
Even before the COVID-19 pandemic, Indiana’s public health system, administered primarily at the local level, struggled to meet the state’s public health challenges. The pandemic further exposed the system’s deficiencies, as well as the geographic, racial, ethnic, and socio-economic disparities in health outcomes that exist across the state. Recognizing that the state can and must do better, Governor Eric Holcomb appointed a 15 member Governor’s Public Health Commission (“the Commission”) charged with examining the strengths and weaknesses of Indiana’s public health system and making recommendations for improvements.
The Commission held monthly meetings from September 2021 through July 2022. Its work was driven through the following six workstreams led by designated policy advisors who conducted research, engaged experts and stakeholders, and developed draft recommendations for the Commission’s consideration: 1) governance, infrastructure, and services, 2) public health funding, 3) workforce, 4) data and information integration, 5) emergency preparedness, and 6) child and adolescent health.
APPROACH
The Indiana Department of Health (IDOH) engaged HMA to support the Commission’s work by providing overall project management support; facilitating the work of the IDOH’s project Steering Committee; and providing staff support for Commission meetings and for each of the six workstreams. This included meeting and agenda planning, preparation of meeting minutes and summaries, public health modernization research, and development of meeting materials. HMA also summarized public input received though the Commission’s website and at seven “Listening Tour” meetings held across the state, prepared a draft final report that included draft findings and recommendations, and collaborated with IDOH as the report was finalized.
RESULTS
The Commission’s final report was released on August 4, 2022. The report’s findings and recommendations will form the basis of proposed legislation that will be offered in the 2023 session of the Indiana General Assembly, including proposals that would substantially increase public health service and funding across the state.
Reforming Colorado’s Behavioral Health System
THE CLIENT
Colorado Department of Human Services and Behavioral Health Administration.
BACKGROUND
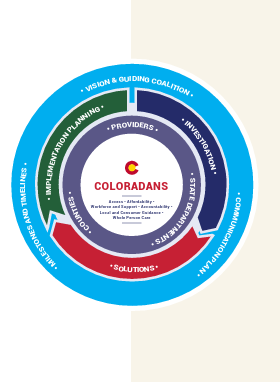
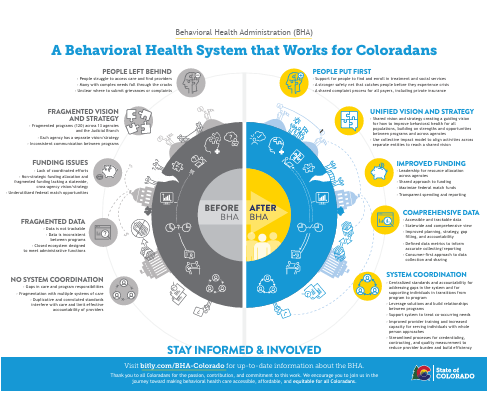
Like many states Colorado has historically struggled with a mixture of challenges relating to its public behavioral health system including funding issues, duplicate processes across multiple state systems, and the absence of a cohesive statewide strategy, which has proved increasingly problematic for Coloradans, especially those with complex needs. The state set out to create a system with a coherent vision and strategy that could provide high quality, equitable and accountable care to all Coloradans.
In 2019, Colorado Governor Jared Polis created a Behavioral Health Taskforce (BHTF) charged with evaluating and setting a roadmap to improve the state’s behavioral health system. The BHTF created a set of more than 200 recommendations that were both structural and programmatic in nature. The most significant structural change was a recommendation to create the Behavioral Health Administration (BHA)—a single accountable entity that would reduce fragmentation across sectors and programs and build a more strategic approach to ultimately improve behavioral health outcomes.
APPROACH
In 2021, HMA began an extensive partnership with the Colorado Department of Human Services to support the planning and implementation of the BHA. The initial project approach incorporated technical research, extensive stakeholder engagement, model design, and change management.
Technical research:
HMA conducted a technical review of over 100 behavioral health programs across 14 state agencies and branches of government including each program’s funding source, program details, population served, eligibility, relevant past and current legislation, administrative rule, waiver authority, contracts, data reporting, and data infrastructure. HMA also conducted research into other state models of reform and conducted interviews with six states on detailed lessons learned from reform efforts.
Stakeholder engagement:
HMA conducted three rounds of extensive statewide stakeholder engagement with more than 700 representatives across all Colorado counties. Stakeholders represented various sectors and feedback focused on: 1) understanding what stakeholders wanted from a BHA which turned into a detailed list of BHA functions; 2) gaining feedback on draft models of the BHA structure and 3) providing an update and response to the final BHA model chosen.
Model design:
HMA drafted multiple models for the BHA and facilitated a detailed evaluation process with the Behavioral Health Reform Executive Committee comprised of the Lieutenant Governor, Executive Directors of the Colorado Departments of Health Care Policy and Financing, Human Services, and Public Health and Environment, the Commissioner of Insurance, and a Deputy County Manager. The process was designed to help the committee consider multiple design elements, weigh pros and cons, and ultimately provide a BHA design recommendation to Governor Polis.
Change management:
HMA employed an extensive change management approach centered on communication and transparency, partnering with communications vendor Merritt+Grace to create a website, a weekly Frequently Asked Questions update, a communication ambassador program across 14 agencies, and a formal change management plan for the BHA process.
RESULTS
The Executive Committee and Governor Polis ultimately chose a model that gives the state the ability to streamline strategy, regulation, funding for high quality and equitable care, and serves as an innovative approach for the nation. Rather than consolidating or moving all behavioral health into one department, the design provides a networked approach to behavioral health and allows for the recognition of expertise in context. The model also positions the state for an expanding impact of behavioral health with future funding on climate change, economics and other factors.
Specific design elements include:
- A cabinet-level position that elevates the criticality of behavioral health
- A single cross-payer and cross-sector behavioral health entity tasked with collaborating across agencies and sectors to drive a comprehensive and coordinated strategic approach to behavioral health
- Better strategy and planning to leverage all funding streams including non-Medicaid, Medicaid and commercial, education, criminal justice, etc., payments for behavioral health, and ensure the state maximizes federal dollars to support the system
- System and services that reflect the “voice” of individuals and families
The governance for the BHA is a cabinet-level commissioner, an interagency council of cabinet members, and an advisory council with diverse representation of individuals and family members with lived experience, local government officials, providers, tribal governments, and others.
ONGOING SUPPORT
HMA created a detailed implementation plan as a final deliverable for the project and has been subsequently providing ongoing support with implementation. HMA has also provided support in the drafting of authorizing legislation, hiring and onboarding of new staff, support in drafting a report for the legislature, additional stakeholder engagement, creation of an innovative access -to-care methodology, and development of interagency agreements to support collaboration with the BHA across all departments. HMA has also continued change management support for the BHA including multiple aspects of the daily operation of the new Administration, which necessitated changes and adjustments to previously existing state offices. It has been our privilege to support Commissioner Dr. Morgan Medlock and her leadership team as they work tirelessly to bring the vision of the BHA to Colorado.
Multiple Clients Accepted into ACO REACH Model
THE CLIENT
Multiple healthcare provider organizations.
BACKGROUND
In early 2022 HMA and Wakely Consulting Group, an HMA Company, assisted multiple clients with their applications to participate in the new Centers for Medicare and Medicaid Services (CMS) Medicare Accountable Care Organization Realizing Equity, Access, and Community Health (ACO REACH) model program. The purpose of this model is to improve quality of care for Medicare beneficiaries through better care coordination and increased engagement between providers and patients including those who are underserved. ACOs and participating providers are held responsible for patients’ total cost of care and must meet certain quality metrics. In return, they have more flexible payment arrangements, can achieve shared savings, and can provide additional services such as telehealth, home-based care, and more options for post-acute care.
APPROACH
The HMA and Wakely team tailored their approach based on each client’s needs. Support included helping clients determine whether to apply; the most appropriate levels of risk and capitation to take on; clinical design, governance structure, and provider recruitment; and how to approach the model’s health equity requirements. The team also provided estimates of the total number of aligned beneficiaries based on client participant provider lists along with financial projections of performance in the program. Finally, the team drafted responses to application questions and provided some clients with a mock score to help them understand strengths and weaknesses of their application.
RESULTS
The application selection process was highly competitive. Of the 271 applications received, CMS accepted just under 50 percent. Notably, nine out of the 10 organizations HMA and Wakely supported were accepted into the model. Since their acceptances, the team has helped many of those clients prepare for implementation on January 1, 2023.

The Impact of the 340B Program on drug prices charged by manufacturers and covered entities
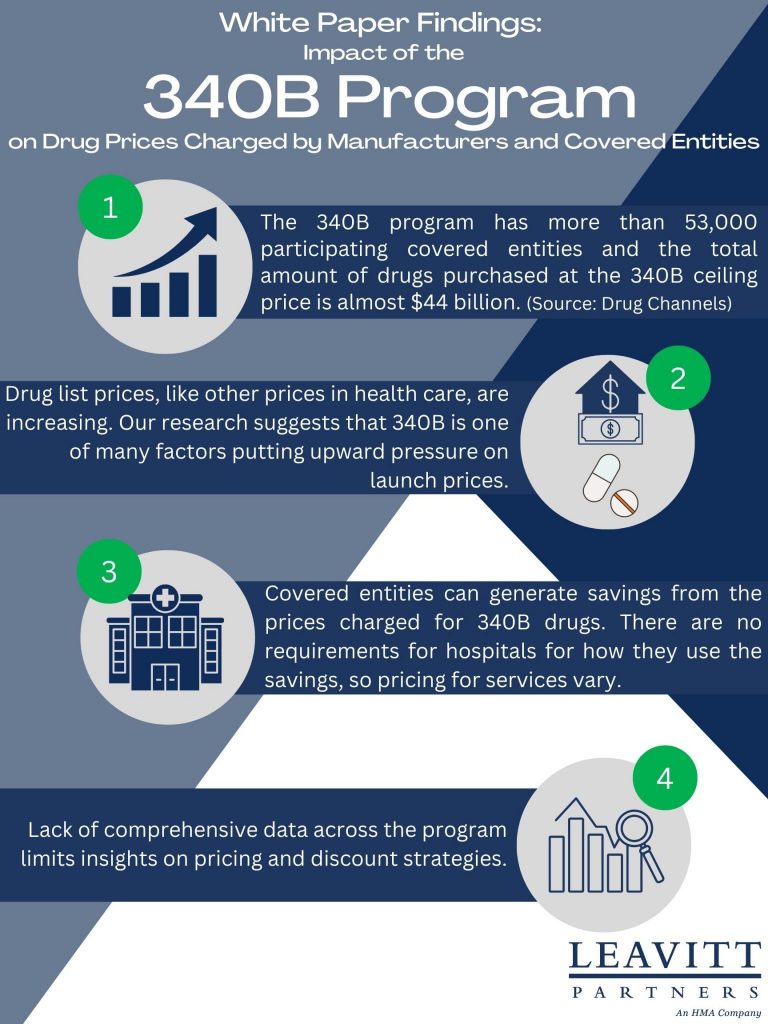
This week, our In Focus highlights a Leavitt Partners white paper, The Impact of the 340B Program on Drug Prices Charged by Manufacturers and Covered Entities, published in November 2022. Leavitt Partners examined publicly available resources to determine the 340B Drug Pricing Program’s (340B) impact on drug prices charged by both covered entities and pharmaceutical manufacturers. To answer these questions, Leavitt Partners undertook a comprehensive literature review of publicly available governmental reports, peer-reviewed journal articles, white papers, news articles, and other publicly available sources to identify the degree to which, and to what extent, the 340B program may impact drug prices. To supplement this literature review, Leavitt Partners also conducted interviews with ten subject matter experts representing the perspectives of covered entities (including Federally Qualified Health Centers, Ryan White Clinics, and Disproportionate Share Hospitals) and drug manufacturers, as well as the analysis of health economists and academic researchers.
Insights/Key Findings:
- The 340B program is a mandatory program for pharmaceutical manufacturers wishing to participate in the Medicaid drug rebate program. Today, the program has more than 53,000 participating covered entities and the total amount of drugs purchased at the 340B ceiling price under the program is almost $44 billion (Drug Channels).
- Drug list prices, like other prices in health care, are increasing. The research for this white paper suggests that 340B is one of many factors putting upward pressure on launch prices.
- Covered entities can generate savings from the prices charged for 340B drugs. There are no requirements for hospitals for how they use the savings, so pricing for services vary.
- Lack of comprehensive data across the program limits insights on pricing and discount strategies.

December 7, 2022
The Impact of the 340B Program on Drug Prices Charged by Manufacturers and Covered Entities
Oklahoma rereleases Medicaid managed care RFPs
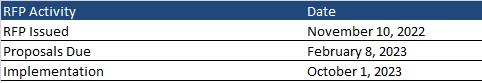
This week, our In Focus reviews the Oklahoma Medicaid managed care SoonerSelect Program request for proposals (RFP) and the SoonerSelect Children’s Specialty Program RFP released by the Oklahoma Health Care Authority (OHCA) on November 10, 2022.
Background
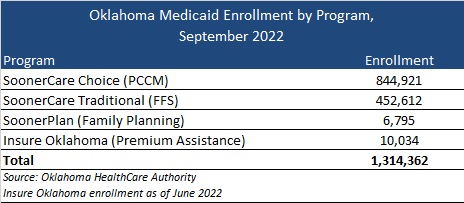
Oklahoma currently does not have a fully capitated, risk-based Medicaid managed care program. The majority of the state’s 1.3 million Medicaid members are in SoonerCare Choice, a Primary Care Case Management (PCCM) program in which each member has a medical home. Other programs include SoonerCare Traditional (Medicaid fee-for-service), SoonerPlan (a limited benefit family planning program), and Insure Oklahoma (a premium assistance program for low-income people whose employers offer health insurance).
Prior efforts to transition to Medicaid managed care have encountered roadblocks, starting in 2017 with a failed attempt to move aged, blind, and disabled members to managed care.
More recently, in June 2021, the Oklahoma Supreme Court struck down a planned transition of the state’s traditional Medicaid program to managed care, ruling that the Oklahoma Health Care Authority does not have the authority to implement the program without legislative approval.
Contracts had been awarded to Blue Cross Blue Shield of Oklahoma, Humana, Centene/Oklahoma Complete Health, and UnitedHealthcare. Centene/Oklahoma Complete Health also won an award for the SoonerSelect Children’s Specialty Program.
In May 2022, Governor Kevin Stitt signed a new Oklahoma law to implement Medicaid managed care by October 1, 2023.
SoonerSelect RFP
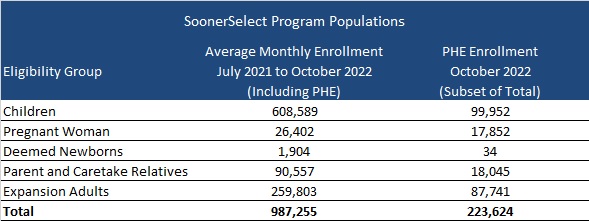
Oklahoma will award contracts to at least three entities to provide medical, behavioral, and pharmacy coverage to nearly one million eligible children, pregnant women, newborns, parents and caretake relatives, and the expansion population. However, enrollment in these populations is expected to drop following the end of the public health emergency (PHE).
At least one of the contracts may be awarded to a provider-led entity (PLE). PLEs would need to provide proof that a majority of their ownership is held by Oklahoma Medicaid providers or the majority of the governing body is composed of individuals who have experience serving Medicaid members and are licensed providers. PLEs would also be able to bid on urban regions if the PLE agrees to develop statewide readiness within a timeframe set by the OHCA. If no PLEs meet OHCA standards, Oklahoma can choose not to award a PLE.
Goals of the program will include:
- Improve health outcomes for Medicaid members and the state as a whole
- Ensure budget predictability through shared risk and accountability
- Ensure access to care, quality measures, and member satisfaction
- Ensure efficient and cost-effective administrative systems and structures
- Ensure a sustainable delivery system that is a provider-led effort and that is operated and managed by providers to the maximum extent possible.
Timeline
Proposals will be due on February 8, 2023, and contract implementation is scheduled for October 1, 2023. The contract is expected to run through June 30, 2024, with five, one-year options.
Evaluation
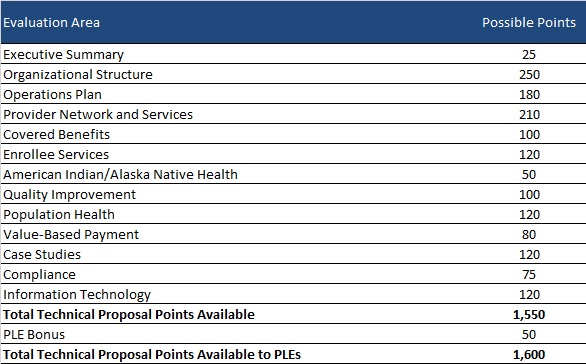
Bidder’s technical proposals will be scored out of a total 1550 points. OHCA will award PLEs an additional 50 points for qualifying, bringing the total up to 1600 points. OHCA may also choose to conduct oral presentations for an extra total of 50 points.
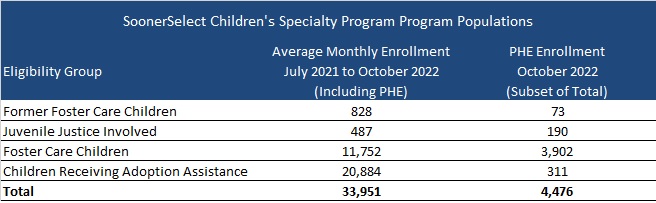
SoonerSelect Children’s Specialty Program RFP
Oklahoma will select one of the awarded SoonerSelect plans for a separate statewide contract to provide comprehensive integrated health coverage to foster children, former foster children up to 25 years of age, juvenile justice-involved children, and children receiving adoption assistance. Contract terms will be the same as the main SoonSelect procurement, running from October 1, 2023, through June 30, 2024, with five one-year renewal options.
November 16, 2022
Should You Put the PHE’s Medicaid Unwinding at the Top of Your To-Do List?
Should you put the PHE’s Medicaid unwinding at the top of your to-do list?
While the current federal COVID-19 Public Health Emergency (PHE) declaration could be in place through the winter months, HMA’s team of experts see many reasons to put the PHE’s Medicaid unwinding planning at the top of your list now.
Without an extension, the PHE declaration will expire on January 11, 2023. U.S. Department of Health and Human Services (HHS) officials pledged to provide 60-days’ notice before ending the PHE. As a result, since HHS did not announce an extension by November 12, we can assume that HHS Secretary Xavier Becerra will extend the PHE beyond January.
However, congressional leaders are again considering proposals that would impact the PHE’s Medicaid policies. Such a change could advance during the lame duck session of Congress. For a variety of reasons, lawmakers could seek a statutory change that would de-link Medicaid’s continuous enrollment requirement, the 6.2 percentage point increase in the federal Medicaid match, and other Medicaid maintenance of effort policies from the PHE declaration. Congress could set a specific date for ending these Medicaid policies. Doing so would provide more certainty for planning for the end of the continuous Medicaid enrollment policy and its downstream implications for health insurance programs.
What can Medicaid agencies, health plans, providers and other stakeholders do now?
The transition from Medicaid’s continuous enrollment requirement to normal eligibility operations involves a myriad of policy decisions and operational changes that will impact enrollees. In turn, the end of Medicaid’s continuous coverage policy will also have great bearing on the business and operational strategies of managed care plans, providers and other stakeholders participating in the Medicaid and Marketplace programs.
HMA’s experts are working with state agencies, health plans, hospitals and health systems, and other stakeholders to identify options and workable solutions to prepare for these major changes. This work touches policy, organizational workstreams, systems, and payment. There are issues specific to Medicaid as well as the intersection with Marketplace, the Supplemental Nutrition Program (SNAP), and other public programs.
Combining our collective on-the-ground experience in states with our federal policy insights, experts from across the HMA family of companies list below themes and immediate actions stakeholders can consider. These action steps are focused on ensuring states, managed care plans, providers and other stakeholders are prepared to immediately respond to the end of the Medicaid continuous enrollment policy and work with individuals to provide information and other support they may need to stay enrolled in a coverage program.
- Monitor and prepare for federal activities, particularly during the lame duck session of Congress and into 2023.
Healthcare policies are likely to feature prominently in Congress’ lame duck session in November and December. Decoupling the Medicaid continuous enrollment and enhanced Federal Medical Assistance Percentage (FMAP) policies from the PHE is one issue under consideration. Any statutory changes to these policies may also include new requirements for the unwinding process. Stakeholders will want to closely monitor these discussions. If Congress sets a statutory end date for the PHE’s Medicaid eligibility policies, this will provide the certainty needed for states to finalize PHE unwinding action plans with target dates for resuming normal eligibility operations. Notably, this may also drive conversations during states’ 2023 legislative sessions. - Stay informed about state-specific landscapes.
With statewide elections largely decided and expectations for a PHE end date sometime in the first part of 2023, now is the time for stakeholders to revisit when and how to engage with state Medicaid and other state agencies to support Medicaid eligibility unwinding plans. Stakeholders will want to solidify strategies and timing for engaging with states as unwinding plans are further solidified and eventually implemented. Stakeholders can also monitor changes to states’ eligibility and enrollment rules – including initiatives designed to simplify eligibility rules, enhance eligibility and enrollment systems, and adjust managed care rate setting policies, among others. Many states are utilizing the temporary federal Medicaid flexibilities to alleviate the significant eligibility unwinding workload. Federal agencies also continue to regularly publish new information for states and stakeholders to consider. Some states are implementing policies designed to improve the transition from Medicaid to Marketplace. Understanding the implications of such policies will help stakeholders anticipate how ending Medicaid’s continuous coverage requirement will directly affect them. - Refresh strategies and messaging for outreach and assistance.
While the PHE end date remains in flux, state plans for ending the Medicaid continuous coverage policy are still evolving. States are refining their beneficiary communication plans and may be developing updated guidance for stakeholders. Health plans, providers, and other stakeholders should align their messaging and outreach work accordingly and continue to build partnerships in communities across the state. However, outreach alone will not be enough to reach all Medicaid enrollees. Many will need assistance in understanding and complying with changes that come with the end of the continuous enrollment policy. For example, stakeholder-provided redetermination assistance will be key to minimizing the number of enrollees who lose coverage for failure to complete the redetermination process and state requirements for stakeholder assistance will vary state by state. - Update projected impact of enrollee transitions between Medicaid and Marketplace programs. For states and stakeholders, especially health plans, it is time to update projections about 2023 Medicaid and Marketplace enrollment. This may also require new analysis and strategies to address the changing population acuity and resulting impact on capitation revenue. For healthcare providers, health systems, and other healthcare facilities, the end of the Medicaid continuous enrollment policy is expected to drive significant changes in payer mix, and it could reduce revenue as well as impact qualifications for special payment programs, the 340B program, among others. Understanding these dynamics can help with budgeting and implementation of specific patient outreach and support strategies.
5. Develop strategies to translate experiences from Medicaid to Marketplace. Medicaid agencies, managed care plans, and providers have gained valuable insights about the needs of individuals who have remained continuously enrolled in Medicaid during the COVID-19 PHE. This is particularly true for Medicaid enrollees diagnosed with a mental illness, substance use disorder, or both. Medicaid providers and health plans have gained valuable insight on effective clinical care models, whole person care, partnerships with community-based organizations and reimbursement strategies that can better meet the needs of complex populations. Providers and plans can utilize these experiences to better support the millions of individuals who are expected to become eligible for Marketplace coverage after Medicaid’s continuous enrollment policy ends.
The HMA team continues to monitor the dynamic state and federal policy landscapes, including state planning documents and new federal guidance and informational tools. We have the ability to support stakeholders to prepare for the end of PHE and to support state and communities by modeling projected enrollment and payer mix changes across health coverage categories. Stakeholders should be using this time to address gaps in their plans for PHE unwinding and continue to identify and evaluate new options that may emerge to support beneficiaries in retaining health coverage.
For more information, contact our experts below.