This week, our In Focus section reviews preliminary 2021 Medicaid spending data collected in the annual CMS-64 Medicaid expenditure report. After submitting a Freedom of Information Act request to the Centers for Medicare & Medicaid Services (CMS), HMA received a draft version of the CMS-64 report that is based on preliminary estimates of Medicaid spending by state for federal fiscal year (FFY) 2021. Based on the preliminary estimates, Medicaid expenditures on medical services across all 50 states and six territories in FFY 2021 was nearly $710.2 billion, with over 59 percent of the total now flowing through Medicaid managed care programs. In addition, total Medicaid spending on administrative services was $30.8 billion, bringing total program expenditures to $741 billion.
Total Medicaid Managed Care Spending
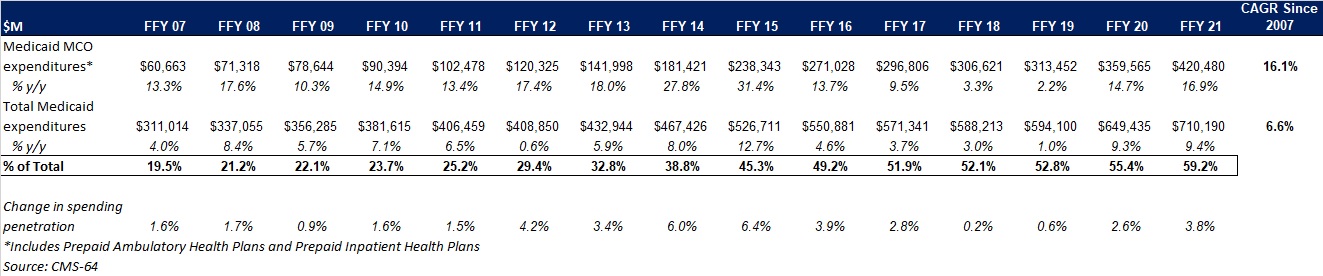
Total Medicaid managed care spending (including the federal and state share) in FFY 2021 across all 50 states and six territories was $420.5 billion, up from $359.6 billion in FFY 2020. This figure includes spending on comprehensive risk-based managed care programs as well as prepaid inpatient health plans (PIHPs) and prepaid ambulatory health plans (PAHPs). PIHPs and PAHPs refer to prepaid health plans that provide only certain services, such as dental services or behavioral health care. Fee-based programs such as primary care case management (PCCM) models are not counted in this total. Below we highlight some key observations:
- Total Medicaid managed care spending grew 16.9 percent in FFY 2021. The rate of growth has been increasing since the COVID-19 pandemic. Prior to 2020, the rate had decelerated since FFY 2016.
- Managed care spending growth was due in large part to the COVID-19 pandemic and the resulting higher Medicaid enrollment.
- In terms of dollars, the increase in Medicaid managed care spending from FFY 2020 to FFY 2021 was $60.9 billion, compared to $46.1 billion from FFY 2019 to FFY 2020.
- Medicaid managed care spending has increased at a compounded annual growth rate (CAGR) of 16.1 percent since FFY 2007, compared to a 6.6 percent growth in total Medicaid spending.
- Compared to FFY 2020, Medicaid managed care spending as a percent of total Medicaid spending in FFY 2021 increased by 3.8 percentage points to 59.2 percent.
Figure 1: Medicaid MCO Expenditures as a Percentage of Total Medicaid Expenditures FFY 2007-2021 ($M)
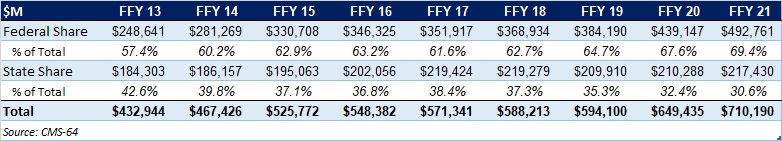
As the table below indicates, 69.4 percent of FFY 2021 spending came from federal sources, which is 12 percentage points higher than the pre-Medicaid expansion share in FFY 2013, and 1.8 percentage points higher than FFY 2020.
Figure 2: Federal vs. States Share of Medicaid Expenditures, FFY 2013-2021 ($M)
State-specific Growth Trends
Forty-five states and territories report managed care organization (MCO) spending on the CMS-64 report, including Alaska, which utilizes a PIHP/PAHP model exclusively. Oklahoma is expected to implement a Medicaid managed care program in 2023. Of the remaining 44 states and territories that contract with risk-based MCOs, average MCO spending in FFY 2021 increased 17.6 percent. On a percentage basis, North Carolina experienced the highest year-over-year growth in Medicaid managed care spending at 63.3 percent due to the implementation of its risk-based Medicaid managed care program. Among states with more mature programs, Colorado experienced the fastest growth in FFY 2021 at 59 percent, followed by Nebraska at 55.6 percent.
The chart below provides additional detail on Medicaid managed care spending growth in states with risk-based managed care programs in FFY 2021.
Figure 3: Medicaid Managed Care Spending Growth on a Percentage Basis by State FFY 2020-21
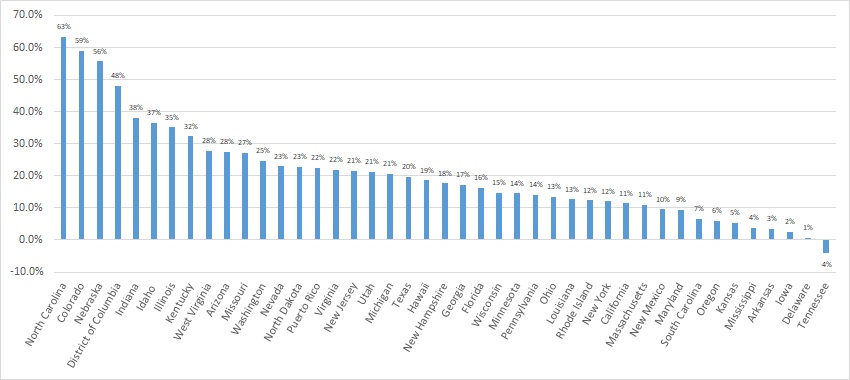
Source: CMS-64; *Note: Not all states are included in the table.
Looking at year-over-year spending growth in dollar terms, Illinois experienced the largest increase in Medicaid managed care spending at $5.5 billion. Other states with significant year-over-year spending increases in dollar terms included Texas ($5.2 billion), California ($5.2 billion), and New York ($5.1 billion). The chart below illustrates the year over year change in spending across the states.
Figure 4: Medicaid Managed Care Spending Growth on a Dollar Basis by State FFY 2020-21 ($M)
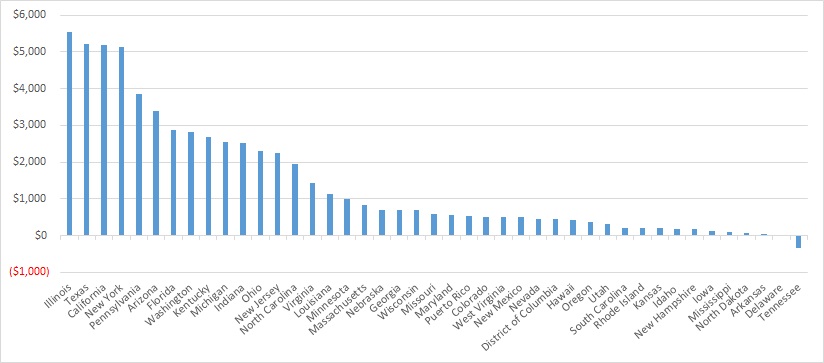
Source: CMS-64; *Note: Not all states are included in the table.
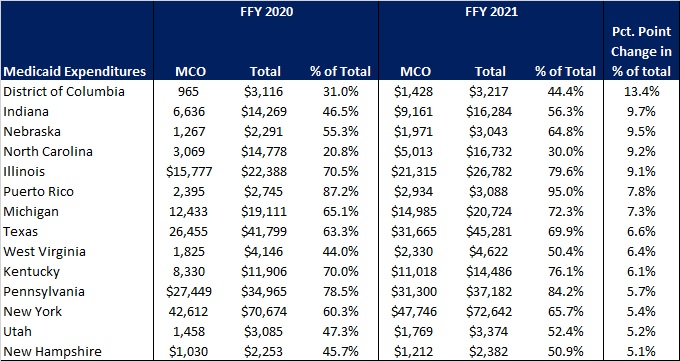
The percentage of Medicaid expenditures directed through risk-based Medicaid MCOs increased by more than five percentage points in 14 states from FFY 2020 to FFY 2021. The managed care spending penetration rate rose 13.4 percentage points in the District of Columbia, 9.7 percentage points in Indiana, 9.5 percentage points in Nebraska, 9.2 percentage points in North Carolina, and 9.1 percentage points in Illinois.
Figure 5: Medicaid MCO Expenditures as a Percentage of Total Medicaid Expenditures in States with a 5 percent or Greater Increase from FFY 2020 to FFY 2021 ($M)
Source: CMS-64
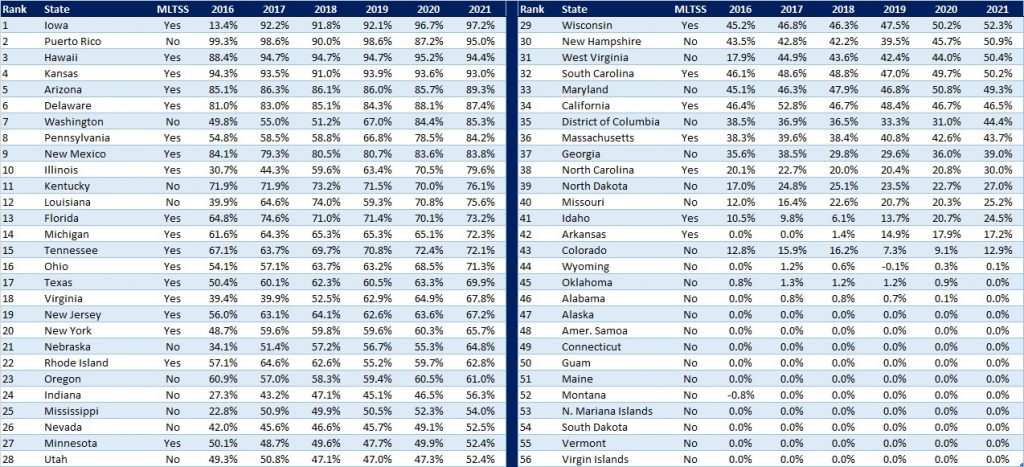
The table below ranks the states and territories by the percentage of total Medicaid spending through Medicaid MCOs. Iowa reported the highest percentage at 97.2 percent, followed by Puerto Rico at 95 percent, and Hawaii at 94.4 percent.
We note that in many states, there are certain payment mechanisms which may never be directed through managed care, such as supplemental funding sources for institutional providers and spending on retroactively eligible beneficiaries. As a result, the maximum achievable penetration rate in each state will vary and may be below that achieved in other states. The Medicaid managed care spending penetration rate is greatly influenced by the degree to which states have implemented managed long-term services and supports (MLTSS) programs.
Figure 6: Medicaid MCO Expenditures as a Percent of Total Medicaid Expenditures, FFY 2016-2021
Non-MCO Expenditures
Despite the rapid growth in Medicaid managed care over the last 10 years, program spending still represented approximately 59 percent of total Medicaid expenditures in FFY 2021. So where is the remaining fee-for-service (FFS) spending (approximately $291 billion) going? First, as noted above, there are many states/territories with Medicaid managed care programs in which certain beneficiaries or services are carved-out of the program, and these are typically associated with high-cost populations. The total amount of non-MCO spending in the 44 states with risk-based managed care in FFY 2021 was $260.4 billion. Assuming an average “full penetration” of 85 percent of total Medicaid spending, then HMA estimates that an additional $221 billion in current FFS spending could shift to a managed care model just in the states that already employ managed care for a subset of services and/or beneficiaries.
Thirteen states/territories did not utilize a comprehensive risk-based managed care model in FFY 2020. In general, the 13 states/territories that do not utilize managed care today are smaller states. Oklahoma, with $5.3 billion in Medicaid spending is expected to shift to risk-based Medicaid managed care in 2023. Total Medicaid spending across all 13 non-managed care states/territories was $29.8 billion. The 13 states/territories that did not employ a risk-based comprehensive Medicaid managed care model in FFY 2021 were Alabama, Alaska, American Samoa, Connecticut, Guam, Maine, Montana, Northern Mariana Islands, Oklahoma, South Dakota, Vermont, Virgin Islands, and Wyoming.
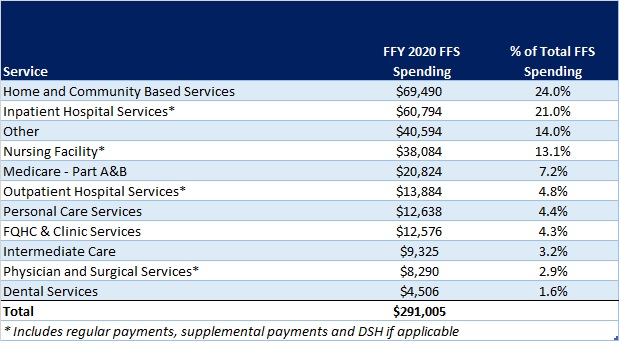
In terms of spending by service line, the largest remaining FFS category is home and community-based services at $69.5 billion, which accounts for 24 percent of FFS spending. Inpatient hospital services represent 21 percent of FFS spending at $60.8 billion.
Figure 7: Fee-for-Service Medicaid Expenditures by Service Line, FFY 2021
While the CMS-64 report provides valuable detail by service line for all FFS expenditures, it does not capture how spending directed to Medicaid MCOs is allocated by category of service. Therefore, it is not possible to calculate total MCO spending by service line, a challenge that will only intensify as more spending runs through MCOs.