This week, our In Focus section reviews Medicaid spending data collected in the annual CMS-64 Medicaid expenditure report. After submitting a Freedom of Information Act request to Centers for Medicare & Medicaid Services (CMS), we have received a draft version of the CMS-64 report that is based on preliminary estimates of Medicaid spending by state for federal fiscal year (FFY) 2018. The final version of the report will be completed by the end of 2019 and posted to the CMS website at that time. Based on the preliminary estimates, Medicaid expenditures on medical services across all 50 states and six territories in FFY 2018 exceeded $588 billion, with over half of all spending now flowing through Medicaid managed care programs. In addition, total Medicaid spending on administrative services was $27.8 billion, bringing total program expenditures to $616 billion.
Total Medicaid Managed Care Spending
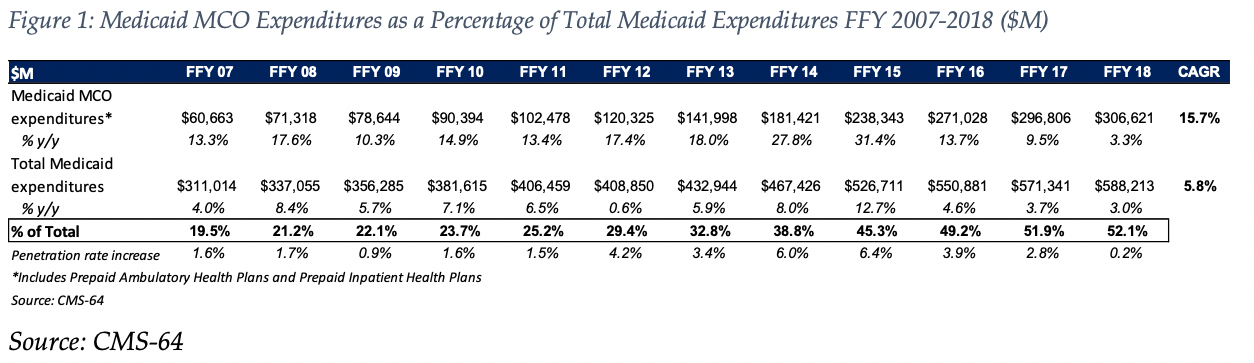
Total Medicaid managed care spending (including the federal and state share) in FFY 2018 across all 50 states and 6 territories was $307 billion, up from $297 billion in FFY 2017. This figure includes spending on comprehensive risk-based managed care programs as well as prepaid inpatient health plans (PIHPs) and prepaid ambulatory health plans (PAHPs). PIHPs and PAHPs refer to non-comprehensive prepaid health plans that provide only certain services, such as dental services or behavioral health care. Fee-based programs such as primary care case management (PCCM) models are not counted in this total. Below we highlight some key observations:
- Total Medicaid managed care spending grew 3.3 percent in FFY 2018, the lowest year-over-year growth rate since at least FFY 2007.The rate of growth has decelerated in each of the last three years.
- This slowing of managed care spending growth, down from a peak of 31.4 percent in FFY 2015, is due in large part to fewer additional states expanding Medicaid under the Affordable Care Act (ACA) as well as fewer states implementing managed long-term care (MLTC) programs than in recent years.
- In dollar terms, the increase from FFY 2017 to FFY 2018 was $9.8 billion compared to $25.8 billion from FFY 2016 to FFY 2017.
- Medicaid managed care spending has increased at a 15.7 percent compounded annual growth rate (CAGR) since FFY 2007, compared to 5.8 percent growth in total Medicaid spending.
- Medicaid managed care spending represented 52.1 percent of total Medicaid spending in FFY 2018. Compared to FFY 2017, the penetration rate increased by 0.2 percentage points, the smallest annual increase since at least FFY 2007.
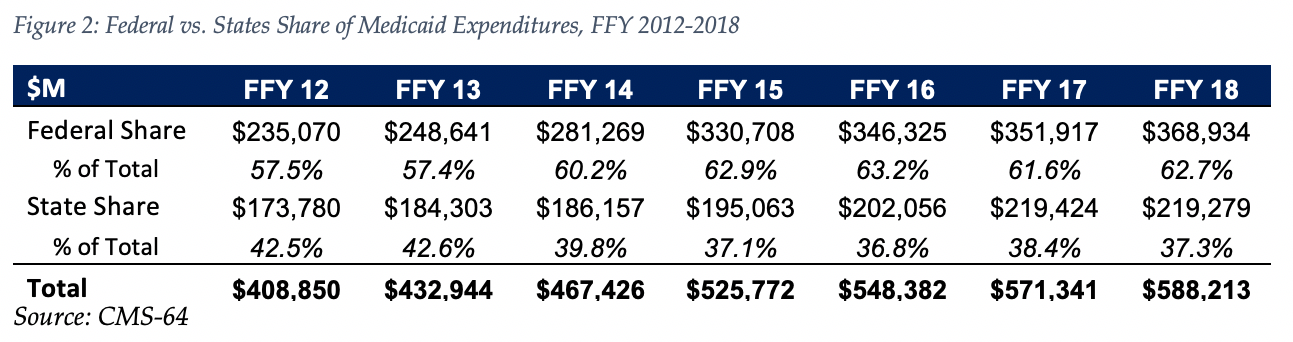
The data breaks down the state and federal share of Medicaid expenditures, which illustrates the impact that the Medicaid expansion, which was initially 100 percent federally funded in the states where it was implemented, has had on the sources of funding.
As the table below indicates, 62.7 percent of FFY 2018 spending was contributed by federal sources, which is 5.3 percentage points higher than the pre-Medicaid expansion share in FFY 2013, and 1.1 percentage points higher than FFY 2017 despite the matching rate reduction for Medicaid expansion enrollees from 95 percent to 94 percent as of January 1, 2018. We note that the state share of Medicaid spending declined on a year over year basis in 2018, but is still greater than the state share in 2016.
State-specific Growth Trends
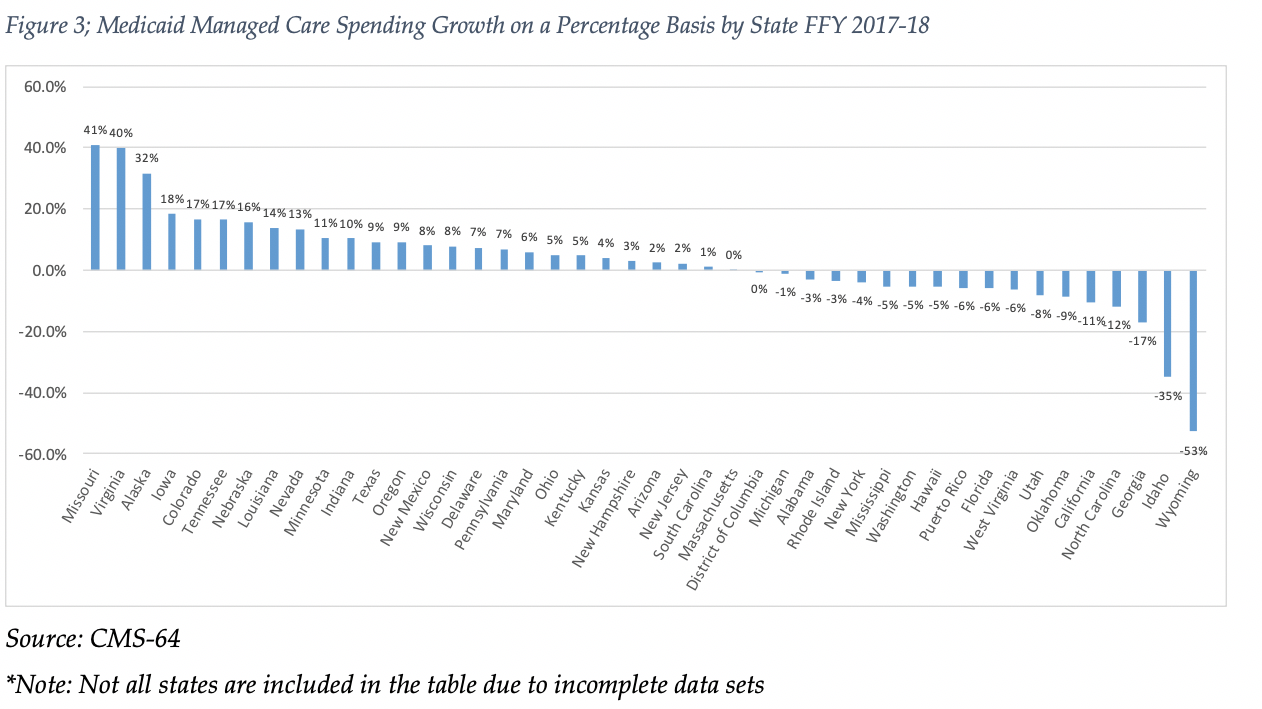
Fourty-seven states and territories report managed care organization (MCO) spending on the CMS-64 report of which six states (Alabama, Alaska, Arkansas, Idaho, North Carolina and Oklahoma) utilize a PIHP/PAHP model exclusively. Of the remaining 41 states and territories that contract with risk-based MCOs, average MCO spending in FFY 2018 increased 3.3 percent. On a percentage basis, North Dakota experienced the highest year-over-year growth in Medicaid managed care spending at 295 percent, though it’s total spending is still just over $300 million. Among states with more mature programs, Missouri experienced the fastest growth in FFY 2018 at 41 percent, which was attributable to expansion of its program statewide for non-disabled parents and children. Virginia also experienced Medicaid managed care spending growth of 40 percent.
The chart below provides additional detail on Medicaid managed care spending growth in states with risk-based managed care programs in FFY 2018. Interestingly, 17 states reported year over year declines in Medicaid managed care spending compared to six in FFY 2017 and two in FFY 2016.
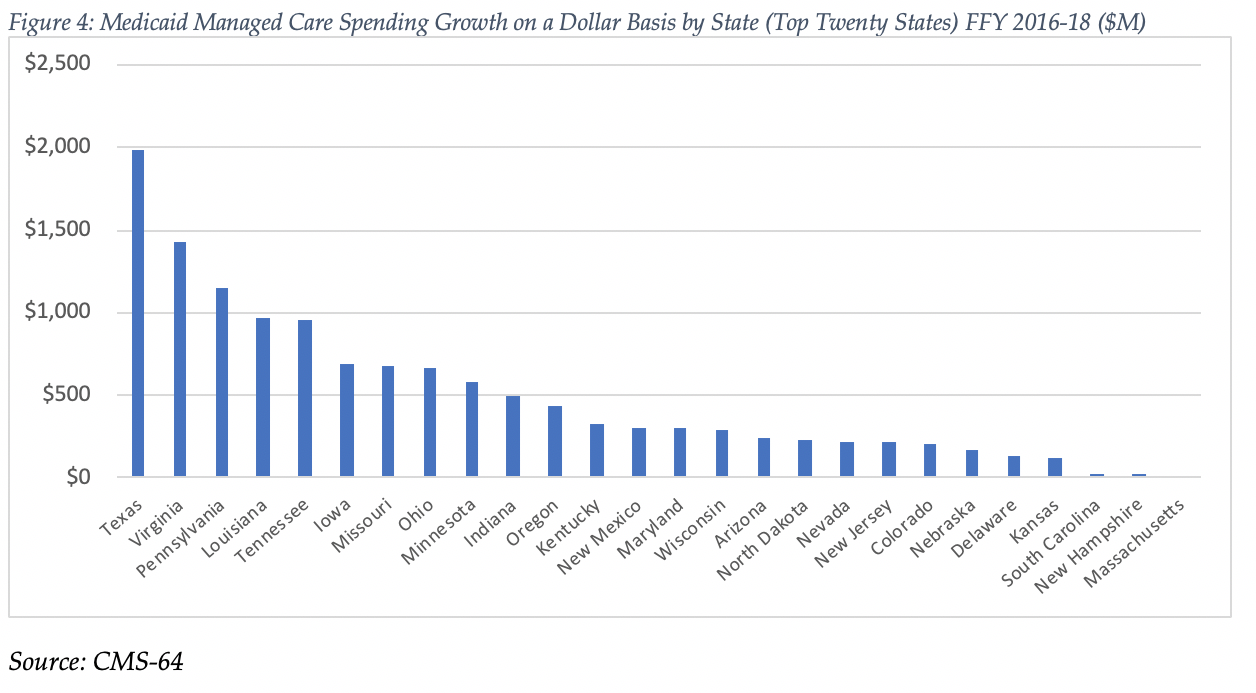
Looking at year-over-year spending growth in dollar terms, Texas experienced the largest increase in Medicaid managed care spending at over $2.0 billion. Other states with significant year-over-year spending increases in dollar terms included Virginia ($1.4 billion) and Pennsylvania ($1.2 billion) The chart below illustrates the year over year change in spending across the 26 states with increases.
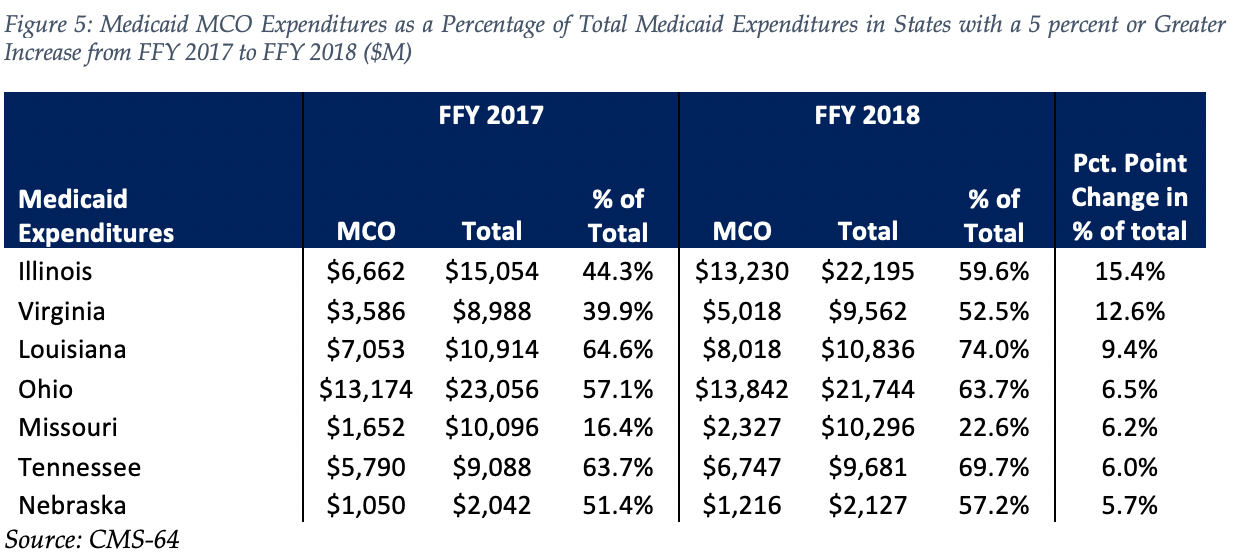
The percentage of Medicaid expenditures directed through risk-based Medicaid MCOs increased by more than 5 percentage points in seven states from FFY 2017 to FFY 2018. The managed care spending penetration rate rose 15.4 percentage points in Illinois, and 12.6 percentage points in Virginia.
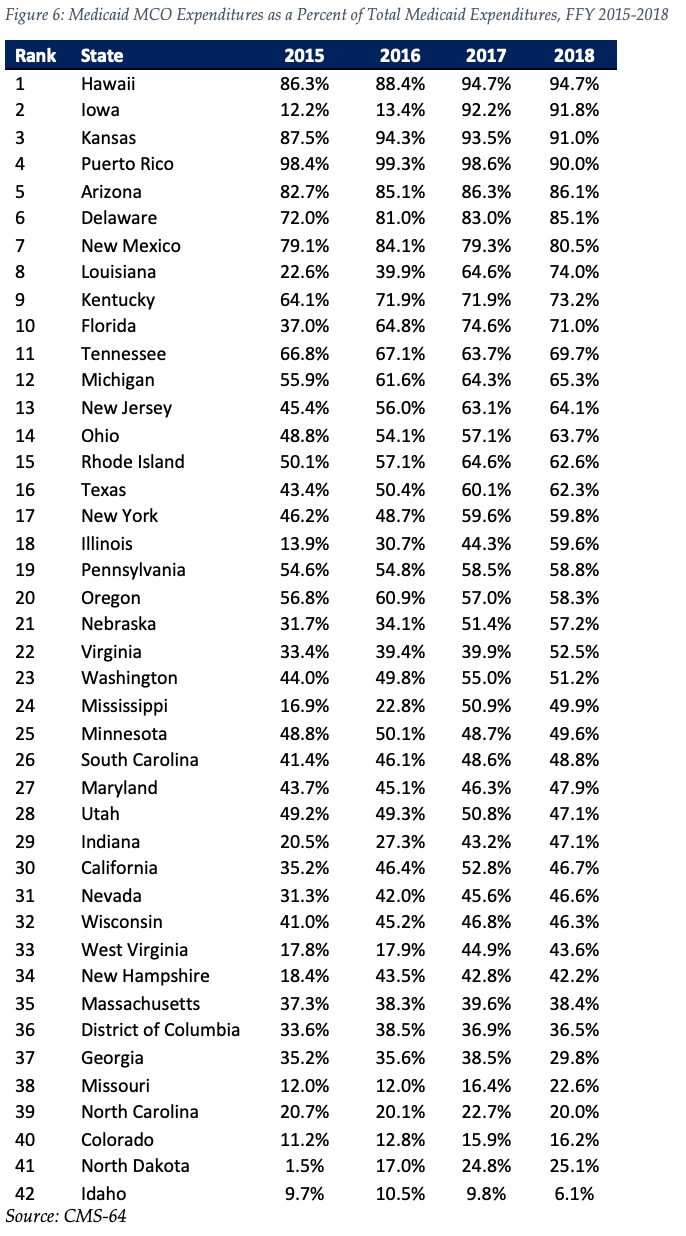
The table below ranks the 42 states and territories with risk-based Medicaid managed care programs by the percentage of total Medicaid spending that is through Medicaid MCOs. Hawaii reported the highest such percentage at 94.7 percent, followed by Iowa at 91.8 percent and Kansas at 91.0 percent. Puerto Rico is fourth on the list after having been first last year.
We note that in many states, there are certain payment mechanisms which may never be directed through managed care such as supplemental funding sources for institutional providers and spending on retroactively eligible beneficiaries. Thus, the maximum acheivable penetration rate in each state will vary and may be below that achieved in other states. In 2019, barring any implementation delays we would expect the biggest increase in the managed care penetration rate to occur in North Carolina where the state will be implementing comprehensive risk based managed care for the first time.
Non-MCO Expenditures
Despite the rapid growth in Medicaid managed care over the last ten years, program spending still represented just over half of total Medicaid expenditures in FFY 2018. So where is the remaining FFS spending (approximately $282 billion) going? First, as noted above, there are many states/territories with Medicaid managed care programs where certain beneficiaries or services are carved-out of the program, and these are typically associated with high-cost populations. The total amount of non-MCO spending in these 42 states in FFY 2018 was around $247 billion. If we were to assume for the sake of argument that “full penetration” was 85 percent of total Medicaid spending, then we estimate that an additional $165 billion in current FFS spending could shift to a managed care model just in the states that already employ managed care for a subset of services and/or beneficiaries.
Next, there are 15 states/territories that did not utilize a comprehensive risk-based managed care model in FFY 2018. In general, the 15 states/territories that do not utilize managed care today are smaller states, North Carolina being the largest at $13 billion of Medicaid spending in FFY 2018. Total Medicaid spending across all 15 non-managed care states was $47.6 billion. The 15 states/territories that did not employ a risk-based comprehensive Medicaid managed care model in FFY 2018 were Alabama, Alaska, American Samoa, Arkansas, Connecticut, Guam, Maine, Montana, Northern Mariana Islands, North Carolina, Oklahoma, South Dakota, Vermont, Virgin Islands and Wyoming.
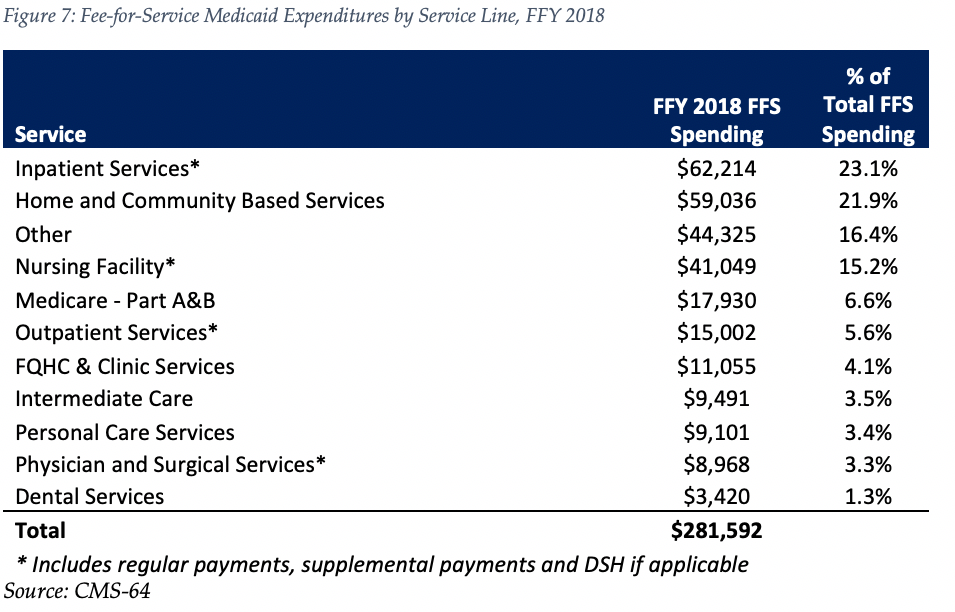
In terms of spending by service line, the largest remaining fee-for-service (FFS) category is inpatient services, at $62 billion or 23.1 percent of FFS spending. This amount is split fairly evenly between regular FFS payments (47 percent of total) and supplemental/Disproporate Share Hospital (DSH) payments (53 percent). Measured as a whole, however, we estimate long term care services and supports (including nursing facility, waiver and other home and community based services) represent the largest FFS funding category.
Finally, we note that while the CMS-64 report provides valuable detail by service line for all FFS expenditures, it does not capture how spending directed to Medicaid MCOs is allocated by category of service. As such, it is not possible to calculate total spending by service line, a challenge that will only intensify as more spending runs through MCOs.