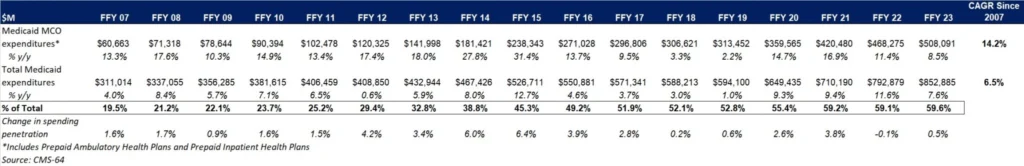
This week, our In Focus section analyzes preliminary 2023 Medicaid spending data collected in the annual CMS-64 Medicaid expenditure report. After submitting a Freedom of Information Act request to the Centers for Medicare & Medicaid Services (CMS), HMA received a draft version of the CMS-64 report that is based on preliminary estimates of Medicaid spending by state for federal fiscal year (FFY) 2023. Based on the preliminary estimates, Medicaid expenditures on medical services across all 50 states and six territories in FFY 2023 totaled nearly $852.9 billion, with 59.6 percent of that amount now flowing through Medicaid managed care programs. In addition, total Medicaid spending on administrative services was $33.8 billion, bringing total program expenditures to $886.7 billion.
Total Medicaid Managed Care Spending
Total Medicaid managed care spending (including the federal and state share) in FFY 2023 across all 50 states and six territories was $508.1 billion, up from $468.3 billion in FFY 2022. This figure includes spending on comprehensive risk-based managed care programs as well as prepaid inpatient health plans (PIHPs) and prepaid ambulatory health plans (PAHPs). PIHPs and PAHPs refer to prepaid health plans that provide only certain services, such as dental or behavioral health care. Fee-based programs such as primary care case management (PCCM) models are not included in this total. Following are some key observations.
- Total Medicaid managed care spending grew 8.5 percent in FFY 2023.
- Managed care spending growth has decreased in since the end of the COVID-19 pandemic, after peaking in FFY 2021.
- In terms of dollars, the increase in Medicaid managed care spending from FFY 2022 to FFY 2023 was $39.8 billion, compared with $47.8 billion from FFY 2021 to FFY 2022.
- Medicaid managed care spending has increased at a compounded annual growth rate (CAGR) of 14.2 percent since FFY 2007, compared with a 6.5 percent growth in total Medicaid spending.
- Compared with FFY 2022, Medicaid managed care spending as a percent of total Medicaid spending in FFY 2023 increased by 0.5 percentage points to 59.6 percent.
Table 1. Medicaid MCO Expenditures as a Percentage of Total Medicaid Expenditures, FFY 2007−2023 ($M)
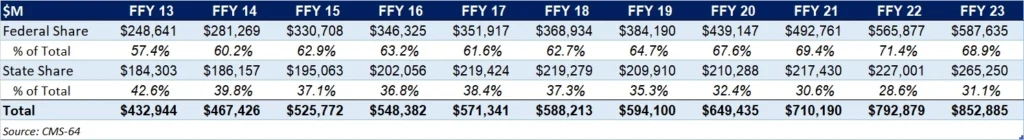
As the table below indicates, 68.9 percent of FFY 2023 spending came from federal sources, which is 11.5 percentage points higher than the pre-Medicaid expansion share in FFY 2013 and 1.3 percentage points higher than FFY 2020.
Table 2. Federal versus State Share of Medicaid Expenditures, FFY 2013−2023 ($M)
State-Specific Growth Trends
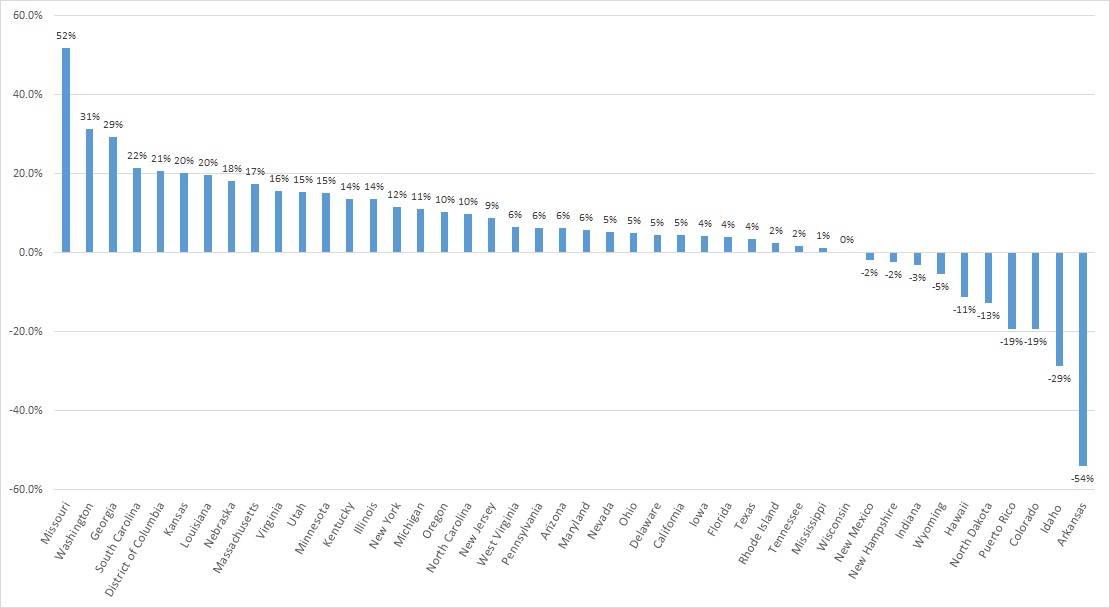
A total of 44 states and territories report managed care organization (MCO) spending in the CMS-64 report. Average MCO spending during FFY 2023 increased 8.5 percent. On a percentage basis, Missouri experienced the highest year-over-year growth in Medicaid managed care spending at 51.7 percent, followed by Washington at 31.4 percent and Georgia at 29.3 percent.
The chart below provides additional detail on Medicaid managed care spending growth in states with risk-based managed care programs in FFY 2023.
Figure 1. Medicaid Managed Care Spending Growth on a Percentage Basis by State, FFY 2022-2023
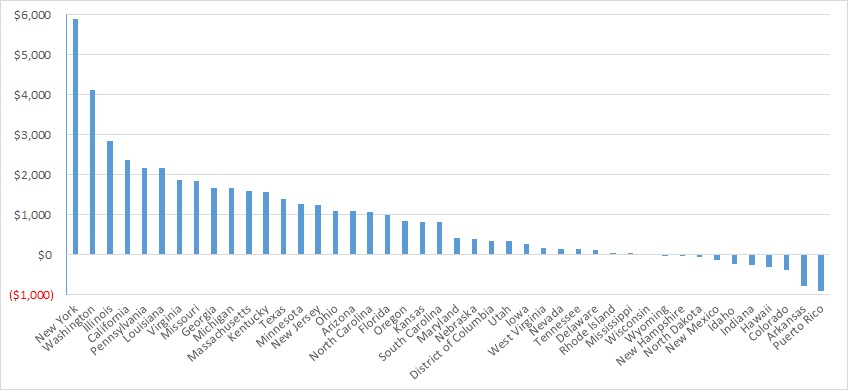
Looking at year-over-year spending growth in terms of dollars, New York experienced the largest increase in Medicaid managed care spending at $5.9 billion. Other states with significant year-over-year spending increases included Washington ($4.1 billion), Illinois ($2.8 billion), and California ($2.4 billion). The chart below illustrates the year-over-year change in spending across the states.
Figure 2. Medicaid Managed Care Spending Growth on a Dollar Basis by State, FFY 2022−2023 ($M)
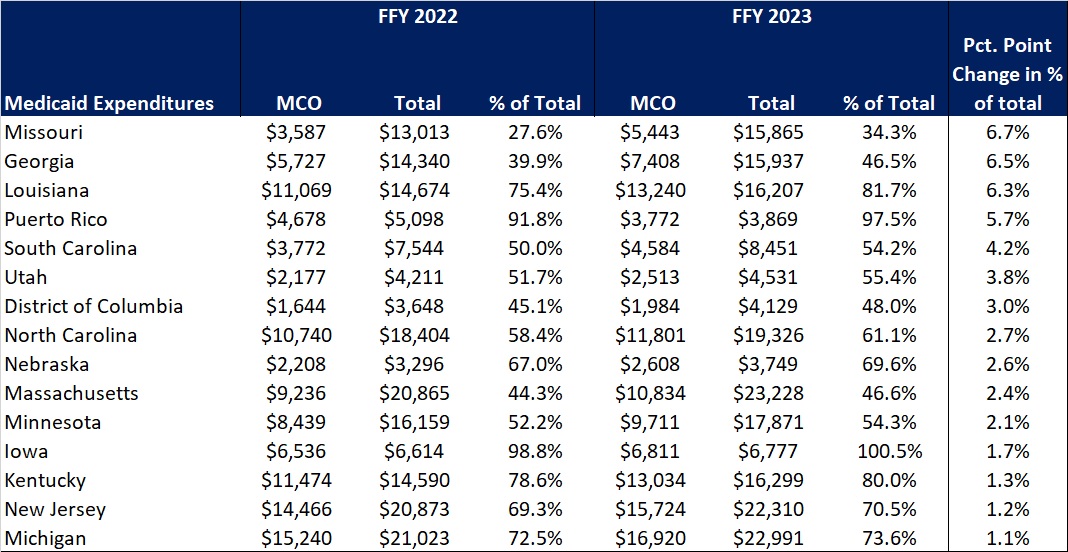
The percentage of Medicaid expenditures directed through risk-based Medicaid MCOs increased by more than one percentage point in 15 states from FFY 2022 to FFY 2023. The managed care spending penetration rate rose 6.7 percentage points in Missouri, 6.5 percentage points in Georgia, 6.3 percentage points in Louisiana, and 5.7 percentage points in Puerto Rico. In all, 22 states saw a decrease in managed care penetration from FFY 2022 to FFY 2023.
Table 3. Medicaid MCO Expenditures as a Percentage of Total Medicaid Expenditures in States with a One percent or Greater Increase from FFY 2022 to FFY 2023 ($M)
The table below ranks the states and territories by the percentage of total Medicaid spending through Medicaid MCOs. Iowa reported the highest percentage at 100 percent, followed by Puerto Rico at 97.5 percent and Kansas at 94.5 percent.
In many states, certain payment mechanisms may never be directed through managed care, such as supplemental funding sources for institutional providers and spending on retroactively eligible beneficiaries. As a result, the maximum achievable penetration rate in each state will vary and may be below the amount achieved in other states. The Medicaid managed care spending penetration rate is greatly influenced by the degree to which states have implemented managed long-term services and supports (MLTSS) programs.
Table 4. Medicaid MCO Expenditures as a Percent of Total Medicaid Expenditures, FFY 2016-2023
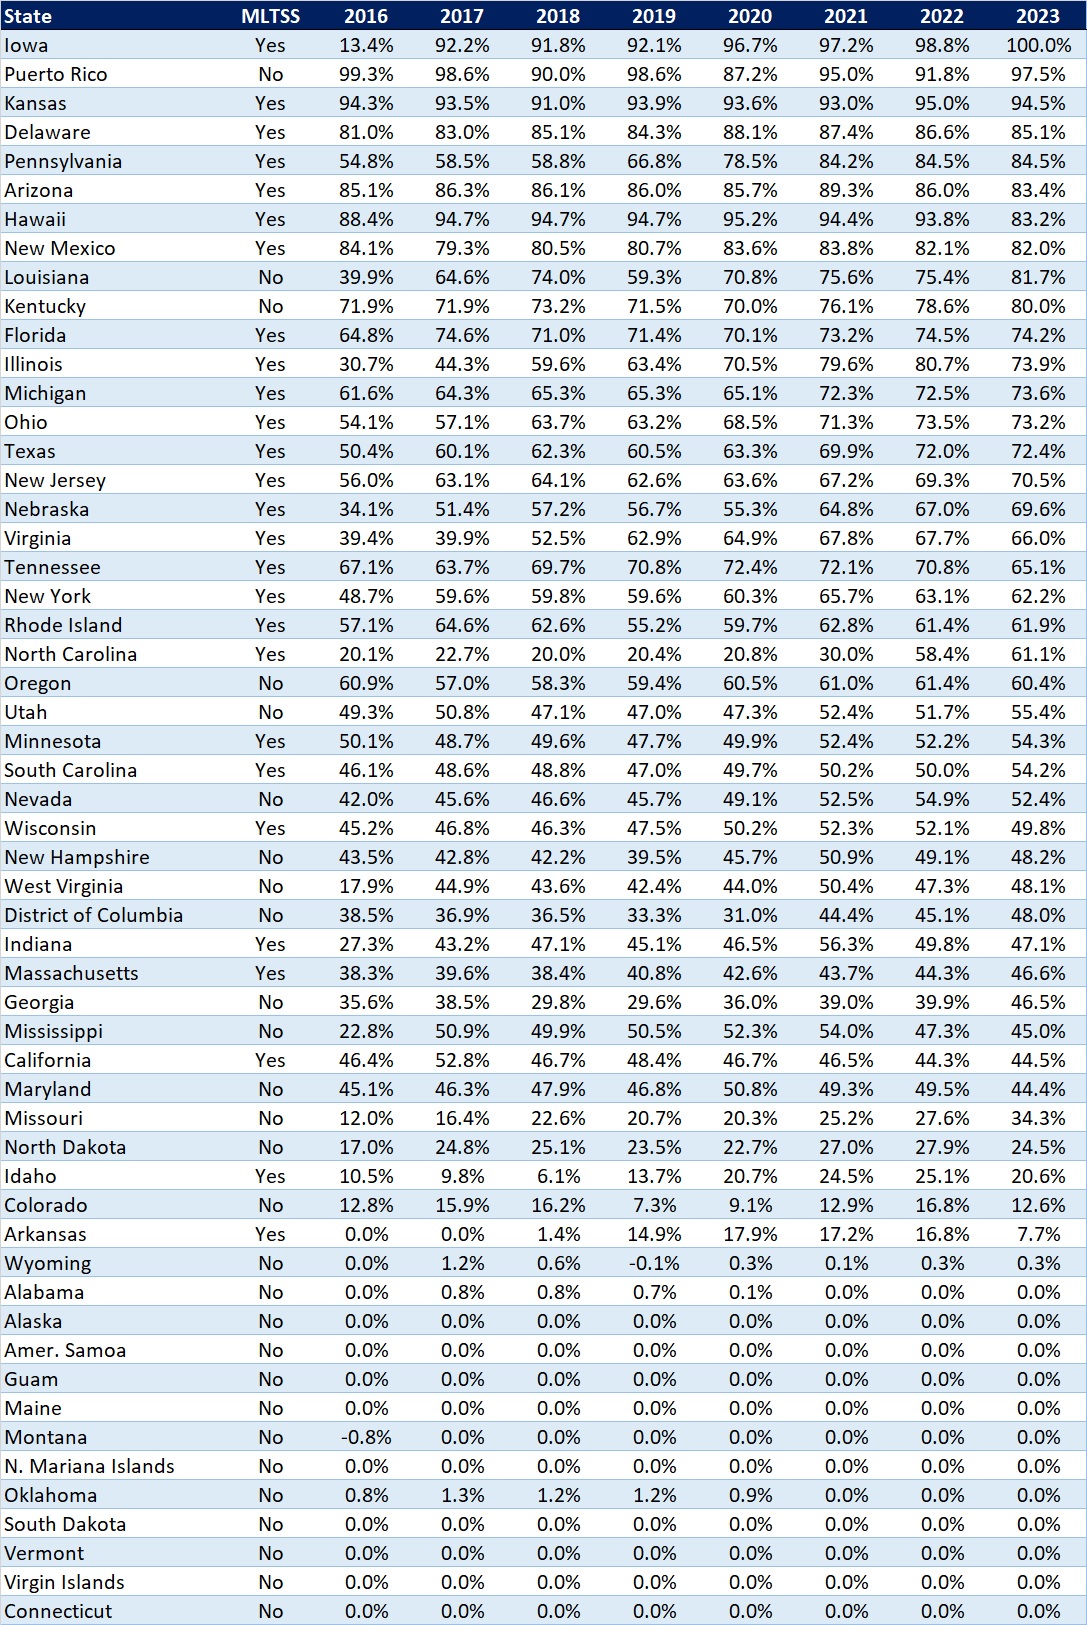
Note: Washington was excluded from the data table.
If you’re interested in becoming an HMAIS subscriber and for access to the CMS-64 data, contact our expert below.