This week, our In Focus section reviews recent Medicaid enrollment trends in capitated, risk-based managed care in 29 states.[1] Many state Medicaid agencies post monthly enrollment figures by health plan for their Medicaid managed care population to their websites. This data allows for the timeliest analysis of enrollment trends across states and managed care organizations. All 29 states highlighted in this review have released monthly Medicaid managed care enrollment data into the second quarter (Q2) of 2019. This report reflects the most recent data posted. HMA has made the following observations related to the enrollment data shown on Table 1 (below):
- The 29 states in this report account for an estimated 49.1 million Medicaid managed care enrollees as of June 2019. Based on HMA estimates of MCO enrollment in states not covered in this report, we believe that, nationwide, Medicaid MCO enrollment is likely over 54 million in 2019. As such, the enrollment data across these 29 states represents approximately 91 percent of all Medicaid MCO enrollment.
- States with managed care that do not publish monthly enrollment reports are Delaware, District of Columbia, Massachusetts, New Hampshire, New Jersey, Nevada, Rhode Island, and Virginia.
- Across the 29 states tracked in this report, Medicaid managed care enrollment is down 2.1 percent year-over-year as of June 2019.
- A majority of the states saw decreases in enrollment in June 2019, compared to previous year.
- Eighteen of the 29 states – Arizona, California, Hawaii, Illinois, Indiana, Iowa, Kentucky, Louisiana, Maryland, Michigan, Minnesota, New Mexico, New York, Ohio, Oregon, Pennsylvania, Washington, and West Virginia – expanded Medicaid under the Affordable Care Act and have seen increased Medicaid managed care enrollment since expansion.
- The 18 expansion states listed above have seen net Medicaid managed care enrollment decrease by 1 million members, or 2.9 percent, in the past year, to 35.6 million members at the end of Q2 2019.
- The 11 states that have not yet expanded Medicaid – Florida, Georgia, Kansas, Mississippi, Missouri, Nebraska, South Carolina, Tennessee, Texas, Utah, and Wisconsin – have seen Medicaid managed care enrollment stay flat at 13.5 million members at the end of Q2 2019.
Table 1 – Monthly MCO Enrollment by State – January 2019 through June 2019
| Jan-19 | Feb-19 | Mar-19 | Apr-19 | May-19 | Jun-19 | |
| Arizona | 1,578,210 | 1,578,668 | 1,578,770 | 1,580,286 | 1,578,523 | 1,575,796 |
| +/- m/m | 4,475 | 458 | 102 | 1,516 | (1,763) | (2,727) |
| % y/y | -1.0% | 0.9% | 1.8% | 1.4% | 1.4% | 1.3% |
| California | 10,596,915 | 10,485,340 | 10,481,494 | 10,458,574 | 10,454,292 | 10,447,222 |
| +/- m/m | 41,519 | (111,575) | (3,846) | (22,920) | (4,282) | (7,070) |
| % y/y | -1.1% | -2.6% | -2.6% | -2.7% | -2.7% | -2.5% |
| Florida | 3,201,630 | 3,195,876 | 3,180,101 | 3,179,606 | 3,171,631 | |
| +/- m/m | (35,712) | (5,754) | (15,775) | (495) | N/A | N/A |
| % y/y | -2.4% | -2.5% | -2.4% | -2.2% | -0.9% | |
| Georgia | 1,362,168 | 1,365,057 | 1,360,916 | 1,367,066 | 1,366,493 | 1,385,707 |
| +/- m/m | 15,232 | 2,889 | (4,141) | 6,150 | (573) | 19,214 |
| % y/y | -1.7% | 0.1% | -0.7% | -0.7% | -1.1% | -0.2% |
| Hawaii | 345,399 | 343,193 | 344,499 | 343,465 | 341,512 | 336,202 |
| +/- m/m | (580) | (2,206) | 1,306 | (1,034) | (1,953) | (5,310) |
| % y/y | -4.1% | -4.9% | -4.4% | -4.7% | -4.7% | -5.0% |
| Illinois | 2,204,240 | 2,171,389 | 2,144,696 | 2,149,482 | 2,151,383 | 2,156,975 |
| +/- m/m | (16,403) | (32,851) | (26,693) | 4,786 | 1,901 | 5,592 |
| % y/y | 12.5% | 17.7% | 20.5% | -6.7% | -5.7% | -4.6% |
| Indiana | 1,104,042 | 1,107,372 | 1,110,550 | 1,114,125 | 1,110,024 | 1,103,966 |
| +/- m/m | (5,166) | 3,330 | 3,178 | 3,575 | (4,101) | (6,058) |
| % y/y | -5.1% | -4.5% | -3.8% | -3.1% | -2.6% | -2.6% |
| Iowa | 613,026 | 614,220 | 614,869 | 615,262 | 637,554 | 636,515 |
| +/- m/m | 76 | 1,194 | 649 | 393 | 22,292 | (1,039) |
| % y/y | 4.0% | 3.4% | 0.9% | 0.1% | 3.6% | 3.3% |
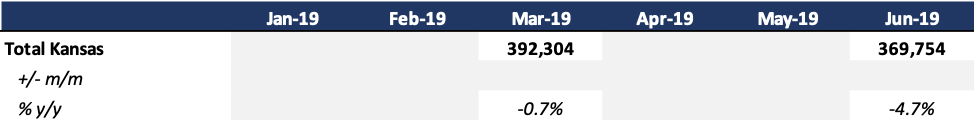
| Kansas | 392,304 | 369,754 | ||||
| +/- m/m | N/A | N/A | N/A | N/A | N/A | N/A |
| % y/y | -0.7% | -4.7% | ||||
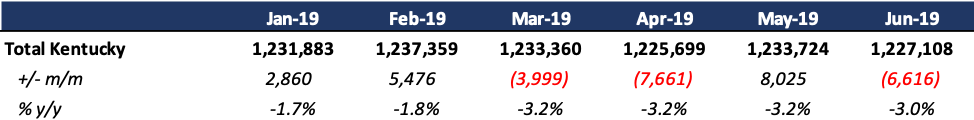
| Kentucky | 1,231,883 | 1,237,359 | 1,233,360 | 1,225,699 | 1,233,724 | 1,227,108 |
| +/- m/m | 2,860 | 5,476 | (3,999) | (7,661) | 8,025 | (6,616) |
| % y/y | -1.7% | -1.8% | -3.2% | -3.2% | -3.2% | -3.0% |
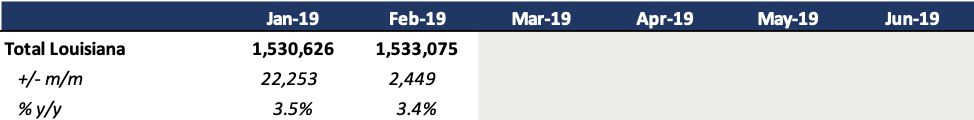
| Louisiana | 1,530,626 | 1,533,075 | ||||
| +/- m/m | 22,253 | 2,449 | N/A | N/A | N/A | N/A |
| % y/y | 3.5% | 3.4% | ||||
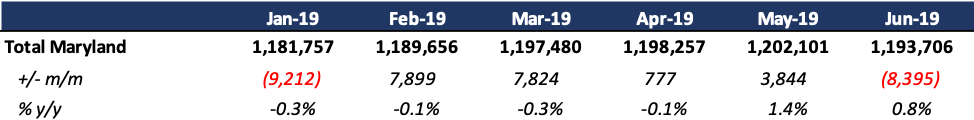
| Maryland | 1,181,757 | 1,189,656 | 1,197,480 | 1,198,257 | 1,202,101 | 1,193,706 |
| +/- m/m | (9,212) | 7,899 | 7,824 | 777 | 3,844 | (8,395) |
| % y/y | -0.3% | -0.1% | -0.3% | -0.1% | 1.4% | 0.8% |
| Michigan | 1,785,796 | 1,799,633 | 1,793,794 | 1,794,178 | 1,757,225 | 1,763,473 |
| +/- m/m | 473 | 13,837 | (5,839) | 384 | (36,953) | 6,248 |
| % y/y | -1.9% | 0.5% | 2.4% | 2.0% | -3.4% | -3.1% |
| Minnesota | 890,567 | 906,201 | 907,283 | 920,757 | 925,638 | 929,986 |
| +/- m/m | (54,503) | 15,634 | 1,082 | 13,474 | 4,881 | 4,348 |
| % y/y | -3.6% | -3.4% | -4.5% | -4.7% | -4.8% | -5.3% |
| Mississippi | 437,875 | 437,329 | 437,194 | 437,150 | 436,689 | 438,658 |
| +/- m/m | 0 | (546) | (135) | (44) | (461) | 1,969 |
| % y/y | -7.0% | -6.0% | -4.5% | -3.8% | -3.4% | -1.9% |
| Missouri | 631,254 | 637,695 | 630,254 | 615,725 | 609,318 | 596,646 |
| +/- m/m | (15,499) | 6,441 | (7,441) | (14,529) | (6,407) | (12,672) |
| % y/y | -12.0% | -10.9% | -11.2% | -13.4% | -14.7% | -16.2% |
| Nebraska | 229,536 | 232,134 | 233,431 | 230,904 | 229,563 | 229,874 |
| +/- m/m | (1,665) | 2,598 | 1,297 | (2,527) | (1,341) | 311 |
| % y/y | -0.4% | -0.5% | -0.4% | -1.6% | -1.8% | -1.7% |
| New Mexico | 660,483 | 660,433 | 660,646 | 662,708 | 662,460 | 660,830 |
| +/- m/m | 540 | (50) | 213 | 2,062 | (248) | (1,630) |
| % y/y | -1.2% | -1.2% | -1.4% | -1.1% | -0.5% | 0.0% |
| New York | 4,721,832 | 4,723,921 | 4,733,247 | 4,710,679 | 4,717,215 | 4,715,683 |
| +/- m/m | (10,249) | 2,089 | 9,326 | (22,568) | 6,536 | (1,532) |
| % y/y | 0.7% | 0.1% | -0.7% | -1.1% | -1.0% | -1.0% |
| Ohio | 2,355,945 | 2,358,776 | 2,344,097 | 2,307,611 | 2,306,389 | 2,277,478 |
| +/- m/m | (6,061) | 2,831 | (14,679) | (36,486) | (1,222) | (28,911) |
| % y/y | -5.4% | -5.3% | -5.8% | -3.8% | -6.8% | -7.0% |
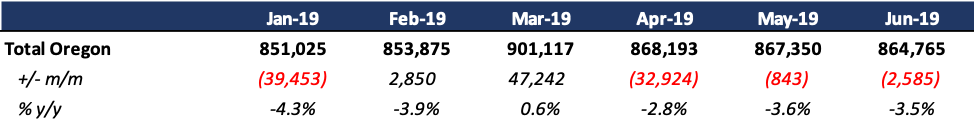
| Oregon | 851,025 | 853,875 | 901,117 | 868,193 | 867,350 | 864,765 |
| +/- m/m | (39,453) | 2,850 | 47,242 | (32,924) | (843) | (2,585) |
| % y/y | -4.3% | -3.9% | 0.6% | -2.8% | -3.6% | -3.5% |
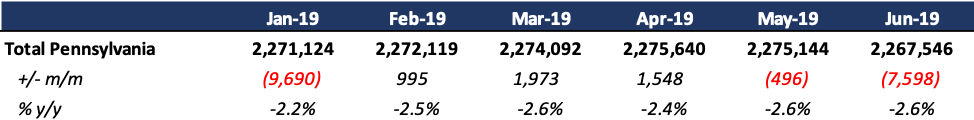
| Pennsylvania | 2,271,124 | 2,272,119 | 2,274,092 | 2,275,640 | 2,275,144 | 2,267,546 |
| +/- m/m | (9,690) | 995 | 1,973 | 1,548 | (496) | (7,598) |
| % y/y | -2.2% | -2.5% | -2.6% | -2.4% | -2.6% | -2.6% |
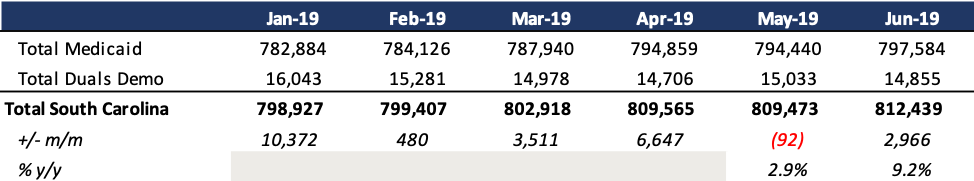
| South Carolina | 798,927 | 799,407 | 802,918 | 809,565 | 809,473 | 812,439 |
| +/- m/m | 10,372 | 480 | 3,511 | 6,647 | (92) | 2,966 |
| % y/y | 0.0% | 0.0% | 0.0% | 0.0% | 2.9% | 9.2% |
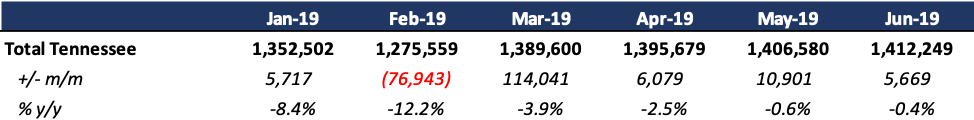
| Tennessee | 1,352,502 | 1,275,559 | 1,389,600 | 1,395,679 | 1,406,580 | 1,412,249 |
| +/- m/m | 5,717 | (76,943) | 114,041 | 6,079 | 10,901 | 5,669 |
| % y/y | -8.4% | -12.2% | -3.9% | -2.5% | -0.6% | -0.4% |
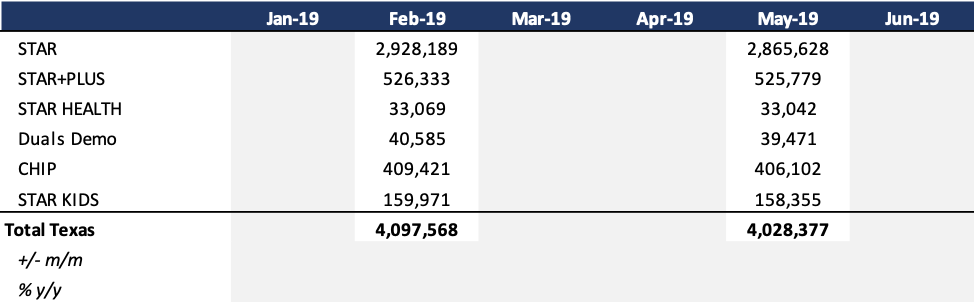
| Texas | 4,097,568 | 4,028,377 | ||||
| +/- m/m | N/A | N/A | N/A | N/A | N/A | N/A |
| % y/y | N/A | N/A | ||||
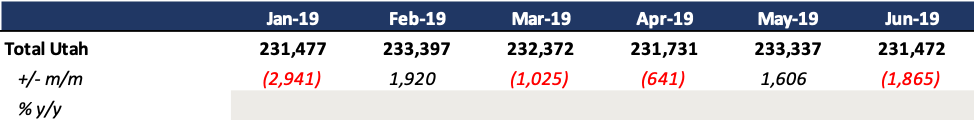
| Utah | 231,477 | 233,397 | 232,372 | 231,731 | 233,337 | 231,472 |
| +/- m/m | (2,941) | 1,920 | (1,025) | (641) | 1,606 | (1,865) |
| % y/y | N/A | N/A | N/A | N/A | N/A | N/A |
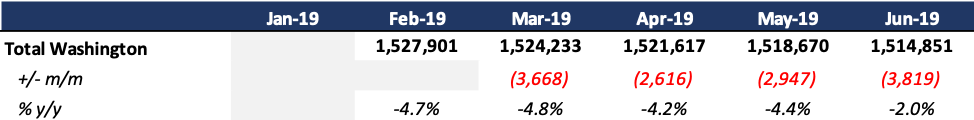
| Washington | 1,527,901 | 1,524,233 | 1,521,617 | 1,518,670 | 1,514,851 | |
| +/- m/m | N/A | N/A | (3,668) | (2,616) | (2,947) | (3,819) |
| % y/y | -4.7% | -4.8% | -4.2% | -4.4% | -2.0% | |
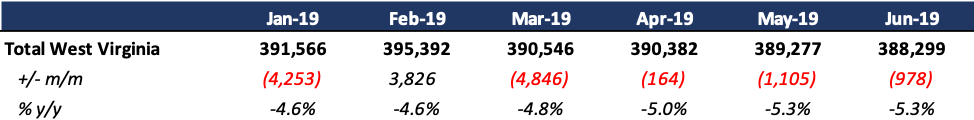
| West Virginia | 391,566 | 395,392 | 390,546 | 390,382 | 389,277 | 388,299 |
| +/- m/m | (4,253) | 3,826 | (4,846) | (164) | (1,105) | (978) |
| % y/y | -4.6% | -4.6% | -4.8% | -5.0% | -5.3% | -5.3% |
| Wisconsin | 794,977 | 804,397 | 802,921 | 803,529 | 809,487 | 809,814 |
| +/- m/m | (1,634) | 9,420 | (1,476) | 608 | 5,958 | 327 |
| % y/y | 1.5% | 0.2% | -0.3% | 0.0% | -0.4% | -0.5% |
Note: In Table 1 above and the state tables below, “+/- m/m” refers to the enrollment change from the previous month. “% y/y” refers to the percentage change in enrollment from the same month in the previous year.
Below, we provide a state-specific analysis of recent enrollment trends in the states where HMA tracks data.
It is important to note the limitations of the data presented. First, not all states report the data at the same time during the month. Some of these figures reflect beginning-of-the-month totals, while others reflect an end-of-the-month snapshot. Second, in some cases the data is comprehensive in that it covers all state-sponsored health programs for which the state offers managed care; in other cases, the data reflects only a subset of the broader managed Medicaid population. This is the key limiting factor in comparing the data described below and figures reported by publicly traded Medicaid MCOs. Consequently, the data we review in Table 1 and throughout the In Focus section should be viewed as a sampling of enrollment trends across these states rather than a comprehensive comparison, which cannot be developed based on publicly available monthly enrollment data.
State-Specific Analysis
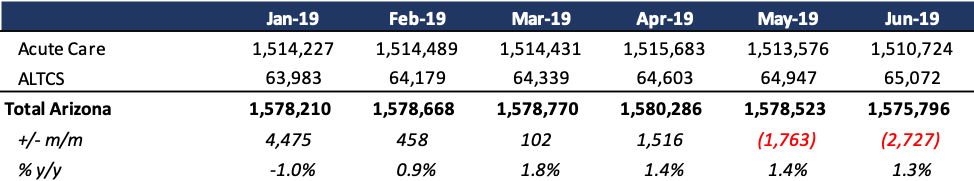
Arizona
Medicaid Expansion Status: Expanded January 1, 2014
Enrollment in Arizona’s two Medicaid managed care programs has grown through June 2019, up nearly 20,000 members since June 2018. As of June 2019, Arizona’s MCO enrollment stands at 1.6 million, up 1.3 percent from the prior year.
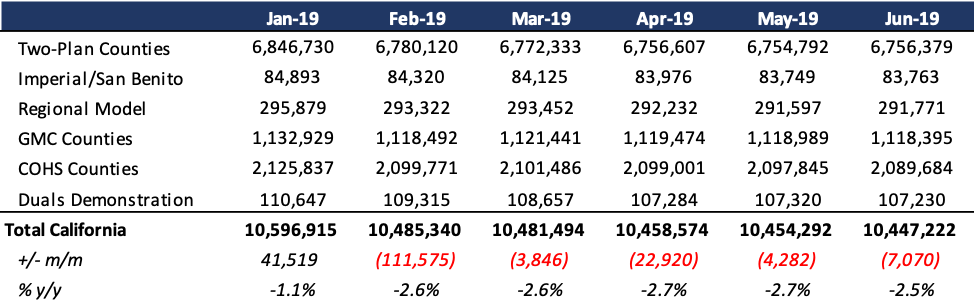
California
Medicaid Expansion Status: Expanded January 1, 2014
Medi-Cal managed care enrollment data shows a decrease of 2.5 percent in June 2019, with managed care enrollment down roughly 268,000 since June 2018. As of June 2019, enrollment in managed care is approximately 10.4 million.
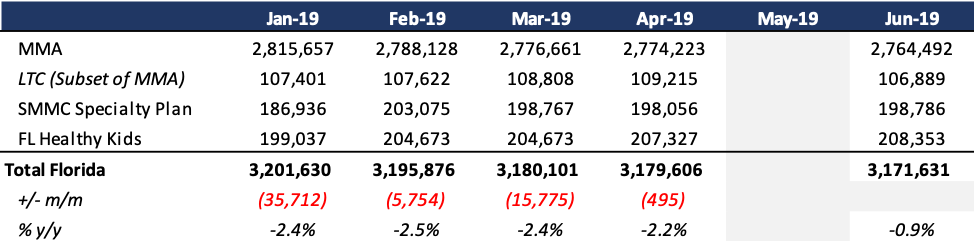
Florida
Medicaid Expansion Status: Not Expanded
Florida’s statewide Medicaid managed care program has seen a 0.9 percent net decline in total covered lives over the last year to 3.2 million beneficiaries as of June 2019. (Note that the managed LTC enrollment figures listed below are a subset of the Managed Medical Assistance (MMA) enrollments and are included in the MMA number; they are not separately added to the total to avoid double counting).
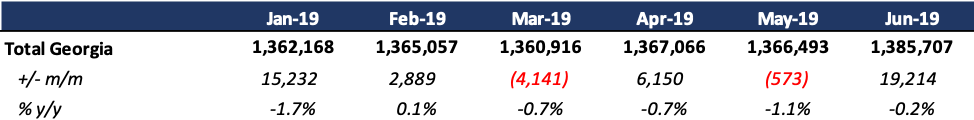
Georgia
Medicaid Expansion Status: Not Expanded
As of June 2019, Georgia’s Medicaid managed care program covered nearly 1.4 million members.
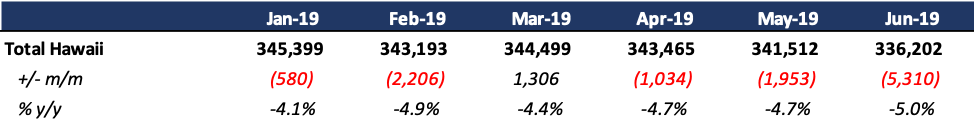
Hawaii
Medicaid Expansion Status: Expanded January 1, 2014
Through June 2019, enrollment in the Hawaii Medicaid managed care program stands at 336,000, down 5 percent from June 2018.
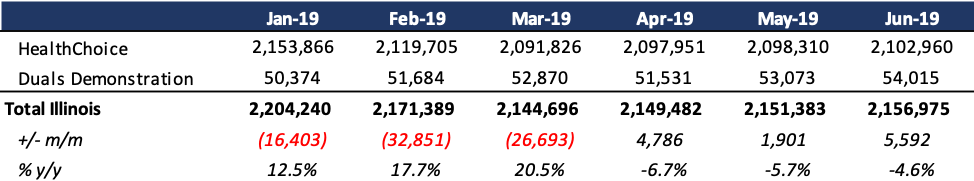
Illinois
Medicaid Expansion Status: Expanded January 1, 2014
Illinois enrollment across the state’s managed care programs sits at 2.2 million as of June 2019, down 4.6 percent from June 2018.
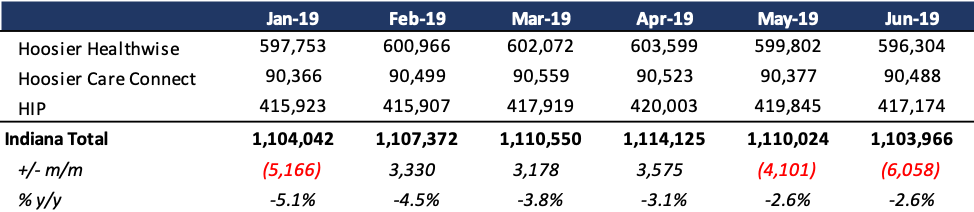
Indiana
Medicaid Expansion Status: Expanded in 2015 through HIP 2.0
As of June 2019, enrollment in Indiana’s managed care programs—Hoosier Healthwise, Hoosier Care Connect, and Healthy Indiana Program (HIP)—is over 1.1 million, down 2.6 percent from the same period the previous year.
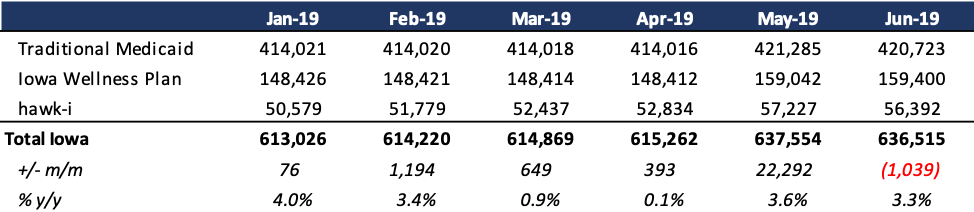
Iowa
Medicaid Expansion Status: Expanded January 1, 2014
Iowa launched its statewide Medicaid managed care program in April of 2016. Enrollment across all populations sits at 637,000 as of June 2019. Enrollment is up 3.3 percent from the previous year.
Kansas
Medicaid Expansion Status: Not Expanded
Kansas Medicaid managed care enrollment was nearly 370,000 as of June 2019, down 4.7 percent from June 2018.
Kentucky
Medicaid Expansion Status: Expanded January 1, 2014
As of June 2019, Kentucky covered 1.2 million beneficiaries in risk-based managed care. Total enrollment is down 3 percent from the prior year.
Louisiana
Medicaid Expansion Status: Expanded July 1, 2016
Medicaid managed care enrollment stands at 1.5 million as of February 2019, up 3.4 percent from the previous year. Louisiana’s Medicaid expansion, which began on July 1, 2016, has been a major driver of MCO enrollment growth over the past five quarters.
Maryland
Medicaid Expansion Status: Expanded January 1, 2014
Maryland’s Medicaid managed care program covered nearly 1.2 million lives as of June 2019, up 0.8 percent from the prior year.
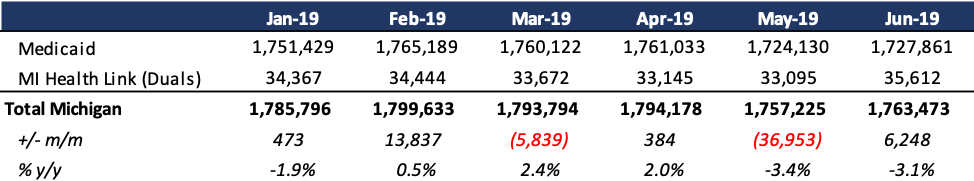
Michigan
Medicaid Expansion Status: Expanded April 1, 2014
As of June 2019, Michigan’s Medicaid managed care sits at roughly 1.8 million, down 3.1 percent from the previous year.
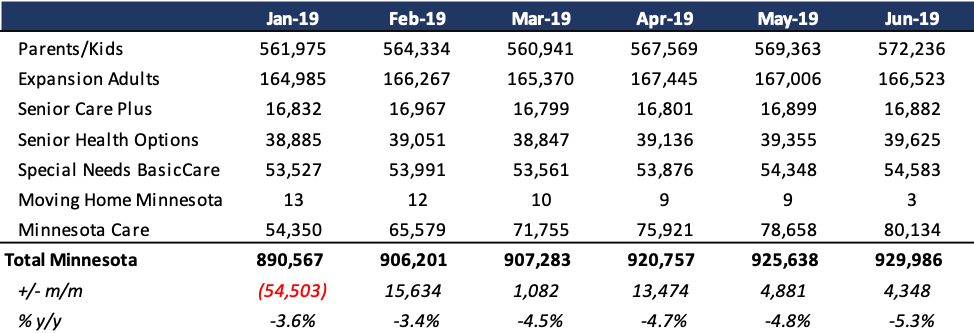
Minnesota
Medicaid Expansion Status: Expanded January 1, 2014
As of June 2019, enrollment across Minnesota’s multiple managed Medicaid programs sits at 930,000, down 5.3 percent from the prior year.
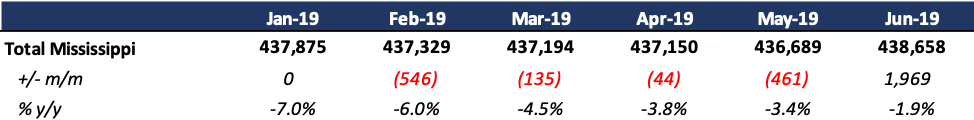
Mississippi
Medicaid Expansion Status: Not Expanded
MississippiCAN, the state’s Medicaid managed care program, grew significantly in 2015. However, net enrollment declines over the past three years have reversed some of this growth. Medicaid managed care membership stands at 439,000 as of June 2019, down 1.9 percent from last year.
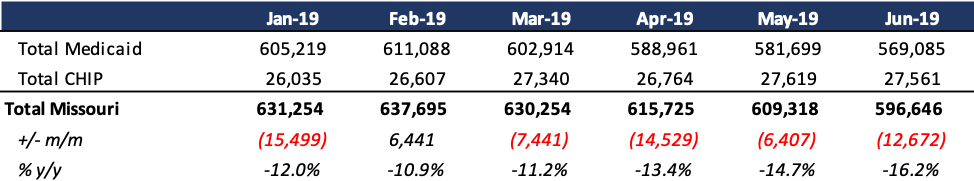
Missouri
Medicaid Expansion Status: Not Expanded
Missouri managed care enrollment in the Medicaid and CHIP programs sits at 597,000 as of June 2019. In May 2017, the first month of the state’s geographic managed care expansion, roughly 240,000 new members were added in the new region. However, enrollment is now down 16.2 percent in June, compared to the prior year. In September 2019, it was reported that nearly 130,000 beneficiaries, about 100,000 of them children, were dropped from the state’s program.
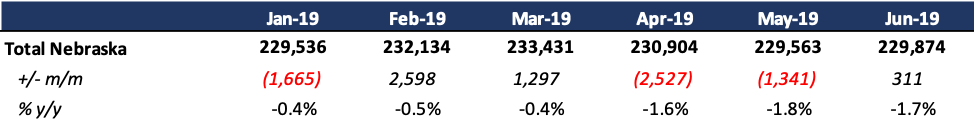
Nebraska
Medicaid Expansion Status: Not Expanded
As of June 2019, the program enrolled 230,000 members, down 1.7 percent from the previous year.
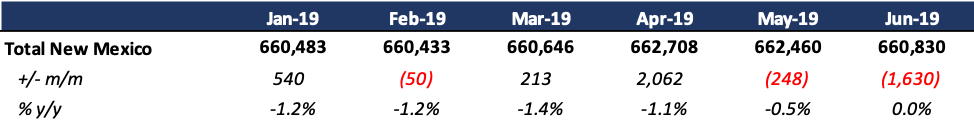
New Mexico
Medicaid Expansion Status: Expanded January 1, 2014
As of June 2019, New Mexico’s Centennial Care program covers nearly 661,000 members.
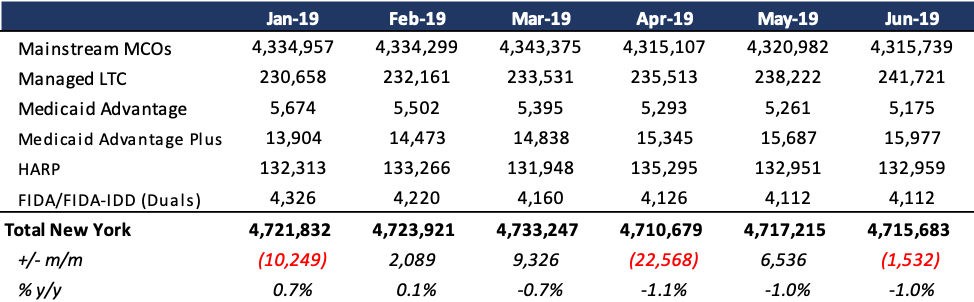
New York
Medicaid Expansion Status: Expanded January 1, 2014
New York’s Medicaid managed care programs collectively covered more than 4.7 million beneficiaries as of June 2019, a 1 percent decrease from the previous year.
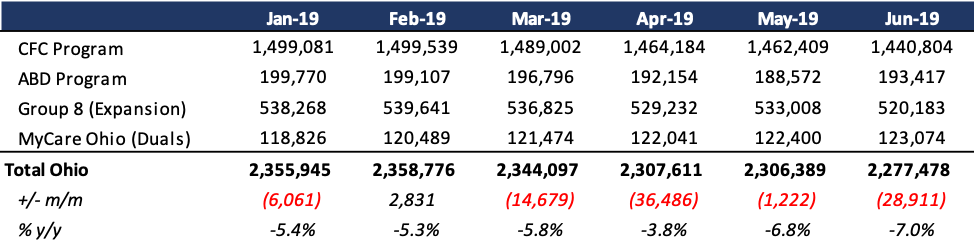
Ohio
Medicaid Expansion Status: Expanded January 1, 2014
As of June 2019, enrollment across all four Ohio Medicaid managed care programs was nearly 2.3 million, down 7 percent from the prior year.
Oregon
Medicaid Expansion Status: Expanded January 1, 2014
As of June 2019, enrollment in the Oregon Coordinated Care Organization (CCO) Medicaid managed care program is 865,000. (This figure includes roughly 1,500 enrolled in managed care other than CCO).
Pennsylvania
Medicaid Expansion Status: Expanded as of 2015
As of June 2019, Pennsylvania’s Medicaid managed care enrollment sits at nearly 2.3 million, down 2.6 percent in the past year.
South Carolina
Medicaid Expansion Status: Not Expanded
South Carolina’s Medicaid managed care programs collectively enroll nearly 812,000 members as of June 2019, which represents an increase of 9.2 percent in the past year.
Tennessee
Medicaid Expansion Status: Not Expanded
As of June 2019, TennCare managed care enrollment totaled 1.4 million, down 0.4 percent from the prior year.
Texas
Medicaid Expansion Status: Not Expanded
Enrollment reporting out of Texas has been limited in the past year. As of May 2019, Texas managed care enrollment stood at 4 million across the state’s six managed care programs, having launched STAR KIDS in the second half of 2016.
Utah
Medicaid Expansion Status: Not Expanded
As of June 2019, Utah’s Medicaid managed care enrollment was over 231,000. Previous years’ enrollment was unavailable.
Washington
Medicaid Expansion Status: Expanded January 1, 2014
Washington’s Medicaid managed care enrollment dropped 2 percent to 1.5 million as of June 2019, compared to June 2018.
West Virginia
Medicaid Expansion Status: Expanded January 1, 2014
As of June 2019, West Virginia’s managed care program covers 388,000 members, down 5.3 percent year-over-year.
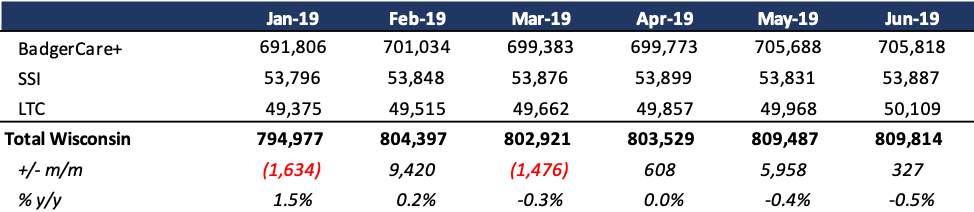
Wisconsin
Medicaid Expansion Status: Not Expanded
Across Wisconsin’s three managed care programs, June 2019 enrollment totals nearly 810,000, up 0.5 percent from the year before.
More Information Available from HMA Information Services
More detailed information on the Medicaid managed care landscape is available from HMA Information Services (HMAIS), which collects Medicaid enrollment data, health plan financials, and the latest on expansions, waivers, duals, ABD populations, long-term care, accountable care organizations, and patient-centered medical homes. HMAIS also includes a public documents library with copies of Medicaid RFPs, responses, model contracts, and scoring sheets.
HMA enhances this publicly available information with an overview of the structure of Medicaid in each state, as well as a proprietary HMA Medicaid Managed Care Opportunity Assessment.
For additional information on how to subscribe to HMA Information Services, contact Carl Mercurio at 212-575-5929 or [email protected].
[1] Arizona, California, Florida, Georgia, Hawaii, Illinois, Indiana, Iowa, Kansas, Kentucky, Louisiana, Maryland, Michigan, Minnesota, Mississippi, Missouri, Nebraska, New Mexico, New York, Ohio, Oregon, Pennsylvania, South Carolina, Tennessee, Texas, Utah, Washington, West Virginia, Wisconsin.