Government Funded Programs and Readiness
As a local or regional managed care organization (LRMCO), being “ready” means proactively addressing all the areas where your organization can get tripped up, or worse, lose your contract with a state Medicaid agency. LRMCOs are heavily reliant upon government funded programs. These include Medicaid, Medicare, and Marketplace business. Most LRMCOs are not as heavily involved in the commercial market, either on a fully insured or self-insured basis, and even when they are, these areas comprise smaller parts of their overall product offerings. National MCOs have looked to Medicaid managed care to fuel growth, strengthen relationships with government partners, and leverage infrastructure.
In any government program, “readiness” is a critical capability that often gets overlooked due to the daily pressures of running the organization. It’s often said that “you should always be audit ready.” The meaning of this is that you and your organization should always be prepared to undergo an outside audit from your regulator, financial auditor, or other entity such as the National Committee for Quality Assurance. Having a well-run organization allows you to not only be ready to respond to regulators or auditors but also to be able to demonstrate stable financial, operational, and compliance performance. Having this stable base of performance allows for more meaningful strategic planning, innovation, and state and federal partnership.
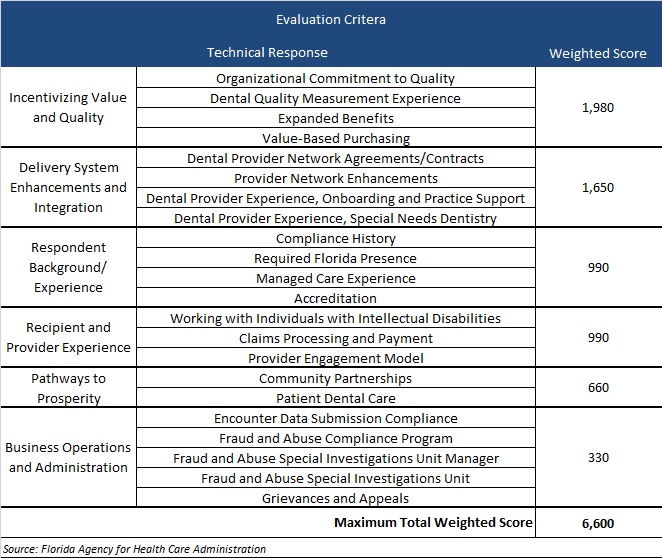
In Medicaid and other government programs, where public purchasers follow stringent purchasing rules, perhaps another way to think of your MCO’s operations is to always be “procurement ready.” But what does it mean to be “procurement ready” for your MCO? Today, managed care is the primary Medicaid delivery system vehicle for most states across the country. While some states procure all Medicaid managed care services in single, comprehensive contracts, many states procure for services via specific programs. Managed long-term services and supports, behavioral health, dental, and other programs are examples of specific programs that states procure alongside those that states have procured historically including low-income children and their parents, pregnant women, people with disabilities, people aged 65 and older, and, with advent of the Affordable Care Act, low-income adults without dependent children. State Medicaid managed care contracts are typically three to five years in duration, often with single or multiple year optional extensions. What this means is that in any given year there are approximately 10 Medicaid managed care program procurements. Moreover, these procurements are now among the largest contracts awarded by states, often exceeding billions of dollars per year. As a result, the importance of being ready for these events has grown substantially over the years.
Being “Ready” Means Being Prepared and Planning in Advance
A critical element of being “procurement ready” is not to rely upon fixing issues when a Medicaid request for proposal (RFP) appears likely; it is to be on top of requirements on an ongoing basis, address issues quickly, and capture success stories as they happen. Too often, LRMCOs don’t look to begin this process until it is too late—a small issue has become a big problem and remediation is expensive, time-consuming, and painful. Even the best proposal will struggle to win in the face of a record of real or perceived suboptimal performance.
The reality is that states are asking for MCO results (Healthcare Effectiveness Data and Information Set scores, state audit findings, Health Insurance Portability and Accountability Act breaches, etc.) as part of RFPs. These data points are hard to hide even with great writing and presentation. States are also more frequently including member or case “scenarios” in RFPs, which are specific in nature and are designed to have the MCO describe exact steps, processes, and outcomes. It is therefore important to monitor and measure for performance year-round.
For incumbent LRMCOs, the best way to maximize your chances of winning a renewal is to deliver effectively—and to be seen as delivering effectively—on your existing contract. A well performing incumbent LRMCO has tremendous advantages because:
- Switching vendors is risky and painful for states, even under the best of circumstances.
- Competitors are less likely to bid when they know the incumbent is well-regarded by the state.
- The key to delivering effectively is continuous assessment and adjustment, so LRMCOs identify potential issues early and can address them before they mushroom into bigger problems.
The time to begin preparing for your next procurement is while you begin to deliver under the existing procurement, not three months before a new procurement.
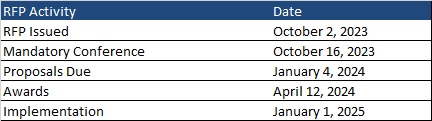
Best practice is to begin RFP planning 18 months to 24 months in advance of the anticipated issuance date. That planning should include developing “win strategies,” competitive assessments, and proposal logistics. Putting remediation initiatives on top of these areas adds unnecessary stress and strain on the LRMCO and the teams responsible for delivering a winning proposal. Therefore, being “procurement ready” is an important and often critical element in ultimately preparing winning proposals.
States look for “partners” not just contractors. LRMCOs can serve as invaluable thought partners to help inform how states can meet their stated policy aims. This not only puts LRMCOs in good standing with state leaders, but it also means they are well informed about state thinking so they won’t be caught by surprise if new requirements appear in the next RFP.
States frequently provide vague guidance on when RFPs will be released (“early next year,” “in the second quarter”, etc.) Some states have published concrete schedules for their multiple RFPs, but this is the exception. The implication for LRMCOs is that it is very difficult to “time” when to get your operations optimally ready for a forthcoming RFP. A wiser approach is to always be ready for an RFP to drop (again, like being audit ready). Some operational, performance, or compliance issues can be addressed in fairly short time frames. Other areas, such as quality reporting, require about a two-year lead time to fix any problems, gather the data, and exhibit optimal performance due to data/reporting lag. Other areas that require longer lead times are claims, encounter data reporting, risk adjustment, delegation oversight, and many others. Due to the lead times required, to be always “procurement ready,” LRMCOs need to have robust operational readiness and monitoring programs established as part of daily operations.
Strategies for Achieving and Maintaining Audit Readiness and Contract Compliance
As noted earlier, strong performance on audits and a consistent record of impressive compliance is an advantage when participating in RFP processes. States prefer to contract with MCOs that have a robust track record of compliance and can persuasively demonstrate their ability to consistently meet the needs of members. Strategies that LRMCOs can employ to develop such a track record include:
- Develop Robust Compliance Programs: LRMCOs should establish comprehensive compliance programs that include policies and procedures, training, monitoring, and auditing. These programs should address all aspects of contract compliance and the specific requirements of the state’s program.
- Internal Controls and Documentation: LRMCOs should implement internal controls to monitor and measure contract compliance regularly. In addition, organizations should maintain thorough documentation of all activities, decisions, and communication. This documentation serves as evidence during audits and demonstrates a commitment to compliance.
- Regular Audits and Self-Assessments: LRMCOs should conduct regular self-assessments and internal audits to identify and rectify potential compliance issues before external audits occur. This proactive approach helps mitigate risks and ensures continuous improvement.
- Data Management and Reporting: LRMCOs should develop robust data management systems to collect, store, and report the necessary data. Accurate and timely reporting is essential for demonstrating compliance with performance measures and outcomes.
- Staff Training and Awareness: LRMCOs should ensure that staff members are well-trained and aware of their roles in maintaining contract compliance. Regular training sessions can keep employees updated on changing regulations and requirements.
- External Auditors and Consultants: LRMCOs should consider engaging external auditors and consultants with expertise in compliance to conduct independent reviews and provide recommendations for improvement.
- Continuous Quality Improvement: LRMCOs should implement continuous quality improvement processes to enhance the quality of care delivered to members. This demonstrates a commitment to improving health outcomes and can positively influence contract awards.
The Value of a Proactive Approach
To be continuously “procurement ready,” LRMCOs must be forward-thinking and adaptive. Embracing change, data-driven decision making, quality improvement, building strong provider networks, investing in technology, engaging stakeholders, and maintaining financial stability are all essential steps to ensure the sustainability and success of these organizations in the intervening years between state-issued RFPs. By taking a proactive approach to addressing these needs, LRMCOs can position themselves as leaders in providing high-quality health care services for the members they serve.
For More Information
If you have questions about how HMA can support your efforts to be ready, please contact our experts below.