HMA Insights: Your source for healthcare news, ideas and analysis.
HMA Insights – including our new podcast – puts the vast depth of HMA’s expertise at your fingertips, helping you stay informed about the latest healthcare trends and topics. Below, you can easily search based on your topic of interest to find useful information from our podcast, blogs, webinars, case studies, reports and more.
ABA Compliance and Strategic Policy Support for Medicaid Managed Care Organizations
Applied Behavior Analysis (ABA) is an evidence-based behavior therapy for people with autism spectrum disorder (ASD) and other developmental disorders. In recent years, the diagnosis of ASD and subsequent demand for ABA services has increased. State Medicaid administrations and Managed Care Organizations (MCOs) are tracking increased ABA utilization and wait times for these services, and in some situations are investigating quality of care and/or fraud, waste, and abuse (FWA) concerns. To optimize quality care for members, MCOs who cover these services must have policies regarding ABA benefit structure, clinical guidelines, utilization management, and service delivery. Plans also need to monitor for and identify possible FWA concerning documentation and/or billing practices for these services. MCOs with comprehensive ABA compliance and auditing programs can meet these critical needs.
Our team
HMA’s national presence keeps us at the forefront of ABA-related changes in multiple states. HMA’s team of behavioral health clinicians have years of experience conducting FWA audits and have specific training required to conduct detailed and meticulous ABA reviews. Our team includes operational and clinical subject-matter experts with board certifications in behavior analysis (BCBA, RBT) who can support auditing activities as well as policy review and revision. We will work with your organization’s team to provide the insights necessary to maximize ABA quality of care and cost efficiency.
How HMA can help
We work closely with MCOs to develop a customized scope of services that meet their unique ABA compliance, policy, and strategy needs.
We can help MCOs with:
Establishing their own ABA compliance programs
Conducting audits of ABA provider claims and associated medical records, using customized audit tools and findings reports, to identify potential FWA, including as part of an MCO’s Special Investigation Unit (SIU) program
Reviewing and providing feedback on ABA-related policies
Developing ABA-related documentation forms
Providing consultation on ABA reimbursement/utilization benchmark development
Providing support in building cohesion/collaboration between MCO and local Department of Developmental Disabilities representatives
Developing strategies to improve care coordination for youth transitioning to adulthood
Assisting MCOs with their Managed Behavioral Healthcare Organizations (MBHO) benefit oversight
Demonstrating how to maximize the interface of organizational Early and Periodic Screening, Diagnostic and Treatment (EPSDT) Medicaid benefits and the intersection with ABA services
We produce results
Our auditing team members have supported the SIUs of three Medicaid health plans in different states. We have demonstrated a 12:1 return on investment for our clients, based on associated recoupment of improper payments and estimated prevented loss.
If you have questions about our ABA compliance, policy, or strategic support services, contact our experts below.
Nicole Lehman is an experienced healthcare professional specializing in the improvement, development, and growth of multifaceted, high-paced managed care organizations. … Read more
Medicaid managed care organizations face mounting pressure as enrollment patterns shift, federal policy evolves, and state budgets tighten. In this webinar, experts from HMAIS, Wakely, and HMA shared exclusive analysis of Medicaid Managed Care Organization (MCO) financial performance, explored the implications of HR 1 and other federal policies, and offered State and MCO perspectives.
Learning Objectives
Interpret 2024 Medicaid MCO financial trends and historical benchmarks to anticipate future market performance.
Assess how federal policy changes, including HR 1, are reshaping Medicaid enrollment and creating new fiscal pressures for States and MCOs.
Evaluate state considerations around risk corridors, medical loss ratios (MLRs), and similar mechanisms in a challenging budget environment.
Identify strategies and planning initiatives that promote resilience, sustainability, and adaptation for Medicaid managed care organizations in a shifting landscape.
This webinar was for Medicaid managed care leaders, state officials, vendors, budget officers, and investors navigating financial pressures and policy shifts.
HMA’s team of expert behavioral health auditors from Crestline Advisors performs audits of behavioral health services, including applied behavior analysis (ABA) services, for a Medicaid health plan in Virginia (“the client”). The client refers cases to HMA when there are allegations of possible fraud, waste, or abuse (FWA) concerning documentation and/or billing practices for these services.
BACKGROUND
ABA is an evidence-based behavior therapy for people with autism spectrum disorder (ASD) and other developmental disorders. In recent years, the diagnosis of ASD and subsequent demand for ABA services has increased. State Medicaid administrations and Managed Care Organizations (MCOs) are tracking increased ABA utilization and wait times for these services, and in some situations are investigating quality of care and/or FWA concerns. Types of FWA concerning ABA therapy services may include billing for services not rendered, billing for ABA services without documentation of ABA-specific interventions, billing for services by unqualified individuals, or billing more units than the documentation supports, to name a few. We have a deep bench of licensed behavioral health clinicians and coders with many years of experience in conducting audits for MCOs, state Medicaid administrations, and providers. Given our expertise, we understand the importance of the golden thread of documentation that should underlie billing, including assessments and treatment plans which identify the need for ABA services and documentation of ABA service interventions, supervision, and family training.
APPROACH
The client’s SIU team identifies providers of ABA services for whom there is an allegation of potential FWA and provides us with sample claims and medical records to review. We have developed customized audit tools to investigate the unique documentation and billing considerations for ABA. Incorporating state-specific provider/billing manual requirements, we conduct pre- and post-pay audits in which we may identify errors in documentation (misalignment with what is billed on the claim). We then provide a detailed report to the client summarizing the identified errors and potential improper payments. Our team also can assist in the pre-audit phase to develop provider communications to request medical records and provides post-audit support to MCOs to help explain findings to providers impacted by the audit, or to support the MCO in an appeal or fair hearing process.
RESULTS
This is an ongoing project that has already provided significant value to our client in a short period of time. The client’s analysis of our auditing work, which included ABA findings reports as well as findings reports for other behavioral health services, has already identified a 12:1 return on investment, based on associated recoupment of improper payments and estimated prevented loss. Our own internal ROI analysis, focused specifically on ABA audits, also identified a 12:1 benefit. By working with our team, MCOs can expect to see timely and thorough identification of potential improper payments upon which they may act to reduce FWA. Ultimately, reducing FWA leads to increased availability of services for the members who need them most and promotes improved quality of care from qualified professionals. To learn more, email Shannon Walters.
This week, our In Focus section highlights findings from Health Management Associates Information Services’ (HMAIS’s) review of 2024 statutory filings submitted to the National Association of Insurance Commissioners (NAIC). These filings provide a nationwide view of Medicaid managed care plan profitability and medical loss ratios (MLRs) across 221 plans operating in 39 states, the District of Columbia, and Puerto Rico.
These data build upon and offer additional context to a previous analysis conducted by HMA and Wakely, an HMA Company, of increasing post-pandemic financial pressures driven by acuity increases resulting from the continuous eligibility unwinding and increases in behavioral health and home and community-based services access and utilization.
Medicaid Managed Care Underwriting Gains and Losses
As state Medicaid programs have increasingly moved from fee-for-service to managed care, a foundational assumption has been that efficient managed care organizations (MCOs) reduce waste and deliver high quality, cost-effective healthcare services. This transition has made Medicaid plan performance and sustainability a central focus for policymakers and actuaries alike.
Medicaid capitation rates must be actuarially sound, which means they must be projected to cover all “reasonable, appropriate, and attainable costs,” including medical administrative costs, plus a margin for insurance risk, even for nonprofit plans. According to the Society of Actuaries 2024 research, average underwriting margins in Medicaid rates ranged from 0.35 percent to 3.15 percent, with a consistent average between 1.2 percent and 1.3 percent.
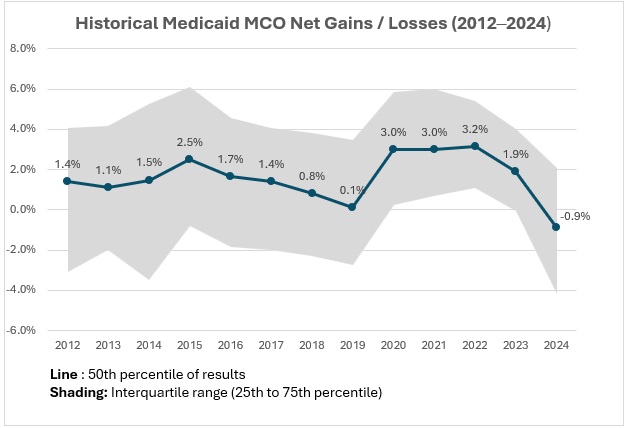
However, actual results often deviate from projections for reasons that may be challenging to predict. Rate setting is an inherently forward-looking process, and even with conservative assumptions, unexpected shifts in enrollment, acuity, or service utilization can lead to significant deviations from projected results. Retrospective reviews show variability in margins over time (see Figure 1).
Based on HMAIS’s analysis, Medicaid MCOs sustained modest but steady gains from 2012 through 2017. After a decline between 2016 and 2019, margins rebounded to approximately 3 percent until 2022, narrowed in 2023 to 1.9 percent, and turned negative in 2024 at -0.9 percent.
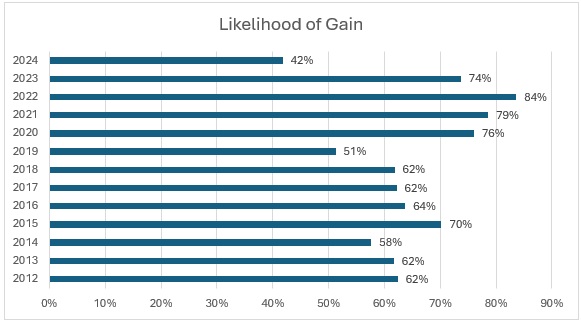
For the first time in over a decade, more plans experienced losses than gains in 2024 (see Figure 2), with only 42 percent reporting positive margins, down from the decade high of 84 percent in 2022. This shift raises critical questions about sustainability and participation in Medicaid managed care.
Figure 2. Medicaid Managed Plans Likelihood of Gain, 2012‒2024 (39 States, DC)
The “Likelihood of Gain” chart tracks the percentage of Medicaid managed care plans reporting an underwriting gain each year from 2012 to 2024. For most years, the likelihood that a plan posted a gain was relatively high, typically between 60 percent and 80 percent. The probability reached a recent peak in 2022, with 84 percent of plans reporting gains, and remained elevated in 2023 (74 percent). In 2024, however, the likelihood of gain dropped sharply to just 42 percent, the lowest level in the 12-year period.
Risk Corridors, Medical Loss Ratios, and Structural Policy Shifts
MLRs show the portion of plan revenue spent on medical care as compared with the costs to operate the plan and the underwriting gain or loss described previously. When MLRs rise or fall, it can be an indication that medical cost trends experienced by health plans differ from the assumptions used by state rate setting actuaries. High MLRs are the key driver of underwriting gains, and low MLRs are associated with higher profitability. All states report MLRs to the Centers for Medicare & Medicaid Services (CMS), and some enforce minimum MLRs with a remittance provision, requiring plans to return funds if their MLR goes below a certain level.
Risk corridors are another tool that states use to manage financial volatility. These mechanisms share gains or losses between plans and states when results deviate significantly from pricing assumptions, offering protection to MCOs and the state alike, in contrast to minimum MLR provisions with a remittance provision, which only protects the state. During the COVID-19 pandemic, many states implemented or expanded risk corridors to recoup overpayments because of lower utilization. Some risk corridors were set retroactively—a practice CMS now prohibits.
In 2024, MLRs reached a decade high of 90.8 percent, as indicated by HMAIS’s analysis. Driving this increase were heightened utilization rates, increased enrollee acuity, and the end of continuous Medicaid coverage protections in 2023. As healthier, lower-cost members left Medicaid, plans were left serving a more complex population with higher per-member costs. Inflation in medical costs—especially for behavioral health and home and community-based services—added more pressure. Delayed or avoided care during the COVID-19 pandemic may also have played a role, as members sought more services in 2022‒2024, resulting in a surge in utilization greater than what was priced into rates.
Many states put risk corridors in place to stabilize margins from 2020 to 2022, which may have contributed to the tight band of outcomes around the high underwriting gains in that period. However, many states have been removing them for 2024, 2025, and 2026. Without these protections, plans may face greater exposure to underpayment in 2025 and 2026 if cost trends continue to outpace rate assumptions.
What to Watch
Rate setting conversations between states and plans for 2026 are happening now, and in many cases they are quite challenging. In addition to meeting actuarial soundness requirements, states also must balance their budgets, and some may be facing limitations on their traditionally used tools.
Looking ahead, it will be increasingly important that states and plans partner to find cost savings that can ensure the program’s long-term sustainability.
A subscription to HMAIS provides access to comprehensive financial intelligence on Medicaid managed care. Far beyond surface-level snapshots, HMAIS delivers health plan-level financial performance metrics, enrollment trends, and state policy developments that directly shape rate setting and operational strategy. Whether you’re a state official, health plan executive, or policy strategist, HMAIS provides the financial clarity and policy context needed to anticipate regulatory shifts, benchmark performance, and make confident, data-driven decisions.
For questions about the analysis discussed in this article, contact our experts below.
Comparative Analysis of the Engagement in Care for Children in Medi-Cal Fee-for-Service vs. Managed Care and Learnings from Enhanced Care Management Early Implementation
In November 2023, the Los Angeles (LA) County Board of Supervisors passed a motion to address the implementation of new benefits for the child welfare-involved population launched through California’s Medicaid waiver, California Advancing and Innovating Medi-Cal, known as CalAIM. The CalAIM waiver expanded services to managed care beneficiaries, including enhanced care management (ECM) for coordinated case management, referrals, and community resource navigation and community supports, such as housing assistance, medically tailored meals, housing modifications, respite care for caregivers, and asthma management. These benefits are designed to better address health and social needs for the most vulnerable and at risk Medi-Cal beneficiaries, including children and youth involved in the child welfare system. The Board directed the Office of Child Protection (OCP), in collaboration with key county departments, to engage Health Management Associates, Inc. (HMA), as the technical assistance provider.
Recognizing that approximately two-thirds of child welfare-involved children and youth in LA County are enrolled in fee-for-service (FFS) Medi-Cal and ineligible for new CalAIM supports, HMA conducted a comparative analysis of the experience of children involved in the child welfare system in FFS versus managed care Medi-Cal through an analysis of federal T-MSIS data looking at a snapshot of data from December 2022. The analysis examined the experience of the child welfare-involved population in primary and preventive healthcare services (including well-child visits, dental visits, behavioral health) in Medi-Cal FFS versus managed care plan enrollment (MCPs) to inform decisions about existing practices for care management among the child welfare-involved population. The comparative analysis of the child welfare population in Los Angeles County, San Diego County, and Riverside County revealed children in managed care consistently showed higher rates of engagement in primary and preventative healthcare services.
As states and stakeholders seek greater transparency and accountability in Medicaid, a new analysis from Health Management Associates (HMA), offers a fresh perspective on how dollars flow through the system. Drawing on publicly available data from the Transformed Medicaid Statistical Information System (T-MSIS), HMA disaggregated funding dispersed to Medicaid managed care organizations to discern spending for specific categorically eligible populations. The findings significantly enhance policy discussions and can facilitate development of pragmatic and specific care management interventions that support quality patient care.
For policymakers, regulators, and other stakeholders, this level of disaggregation provides a clearer view of how public dollars are used—and where there may be opportunities to improve performance or reinvest savings. It also supports more informed rate development and contract negotiations, particularly as states pursue value-based purchasing and other reforms. As Medicaid continues to evolve, especially in the context of budget pressures and changes in enrollment and risk profiles of enrollees, understanding the financial picture of managed care programs is essential to ensuring sustainability.
HMA’s team of experts—including actuaries, former Medicaid directors, and data analysts—has deep experience working with T-MSIS data and advising states, plans, and providers on Medicaid program analysis, evaluation, and strategy. For more information about working with T-MSIS data and the insights it can provide, contact our experts below.
In this week’s In Focus section, Health Management Associates Information Services (HMAIS) draws on its database of monthly enrollment in Medicaid managed care programs to provide the latest quarterly analysis of Medicaid managed care enrollment, offering a snapshot of developments across 28 states.[1] The data and insights are particularly timely as stakeholders, including states, Medicaid managed care organizations (MCOs), hospitals and health systems, and providers, continue to plan for multiple possible federal policy changes and the operational realities that will follow.
HMAIS also compiles a more detailed quarterly Medicaid managed care enrollment report representing nearly 300 health plans in 41 states. The report provides by plan enrollment plus corporate ownership, program inclusion, and for-profit versus not-for-profit status, with breakout tabs for publicly traded plans. Table 1 shows a sampling of plans and their national market share of Medicaid managed care beneficiaries based on a total of 66 million enrollees. These data should be viewed as a broader representation of enrollment trends rather than as a comprehensive comparison.
Key Insights from Q1 2025 Data
The 28 states included in our review have released monthly Medicaid managed care enrollment data via a public website or in response to a public records request from Health Management Associates (HMA). This report reflects the most recent data posted or obtained. HMA has made the following observations related to the enrollment data:
Year-over-year growth. As of March 2025, across the 28 states reviewed, Medicaid managed care enrollment declined by 2.5 million members year-over-year, a 3.9 percent drop as of March 2025 (see Figure 1). This marks a continuation of the downward trend reported in late 2024, though with notable variation across states.
Figure 1. Year-over-Year Growth in Medicaid Managed Care States, 2020−24, March 2025
Localized growth amid broader declines. While most states experienced enrollment reductions, Indiana and North Carolina bucked the trend with measurable gains, suggesting the influence of state-specific policy shifts or demographic factors. Oregon and Texas also saw modest growth.
Sharpest contractions. Illinois, Maryland, and South Carolina, reported double-digit percentage drops, underscoring the uneven impact of redeterminations and eligibility changes.
Difference among expansion and non-expansion states. Among the 21 states included in our analysis that expanded Medicaid, enrollment fell by 1.8 million (-3.6%) to 48.6 million. In contrast, the seven non-expansion states saw a steeper proportional decline (-5.4%), to a total of 12.2 million enrollees.
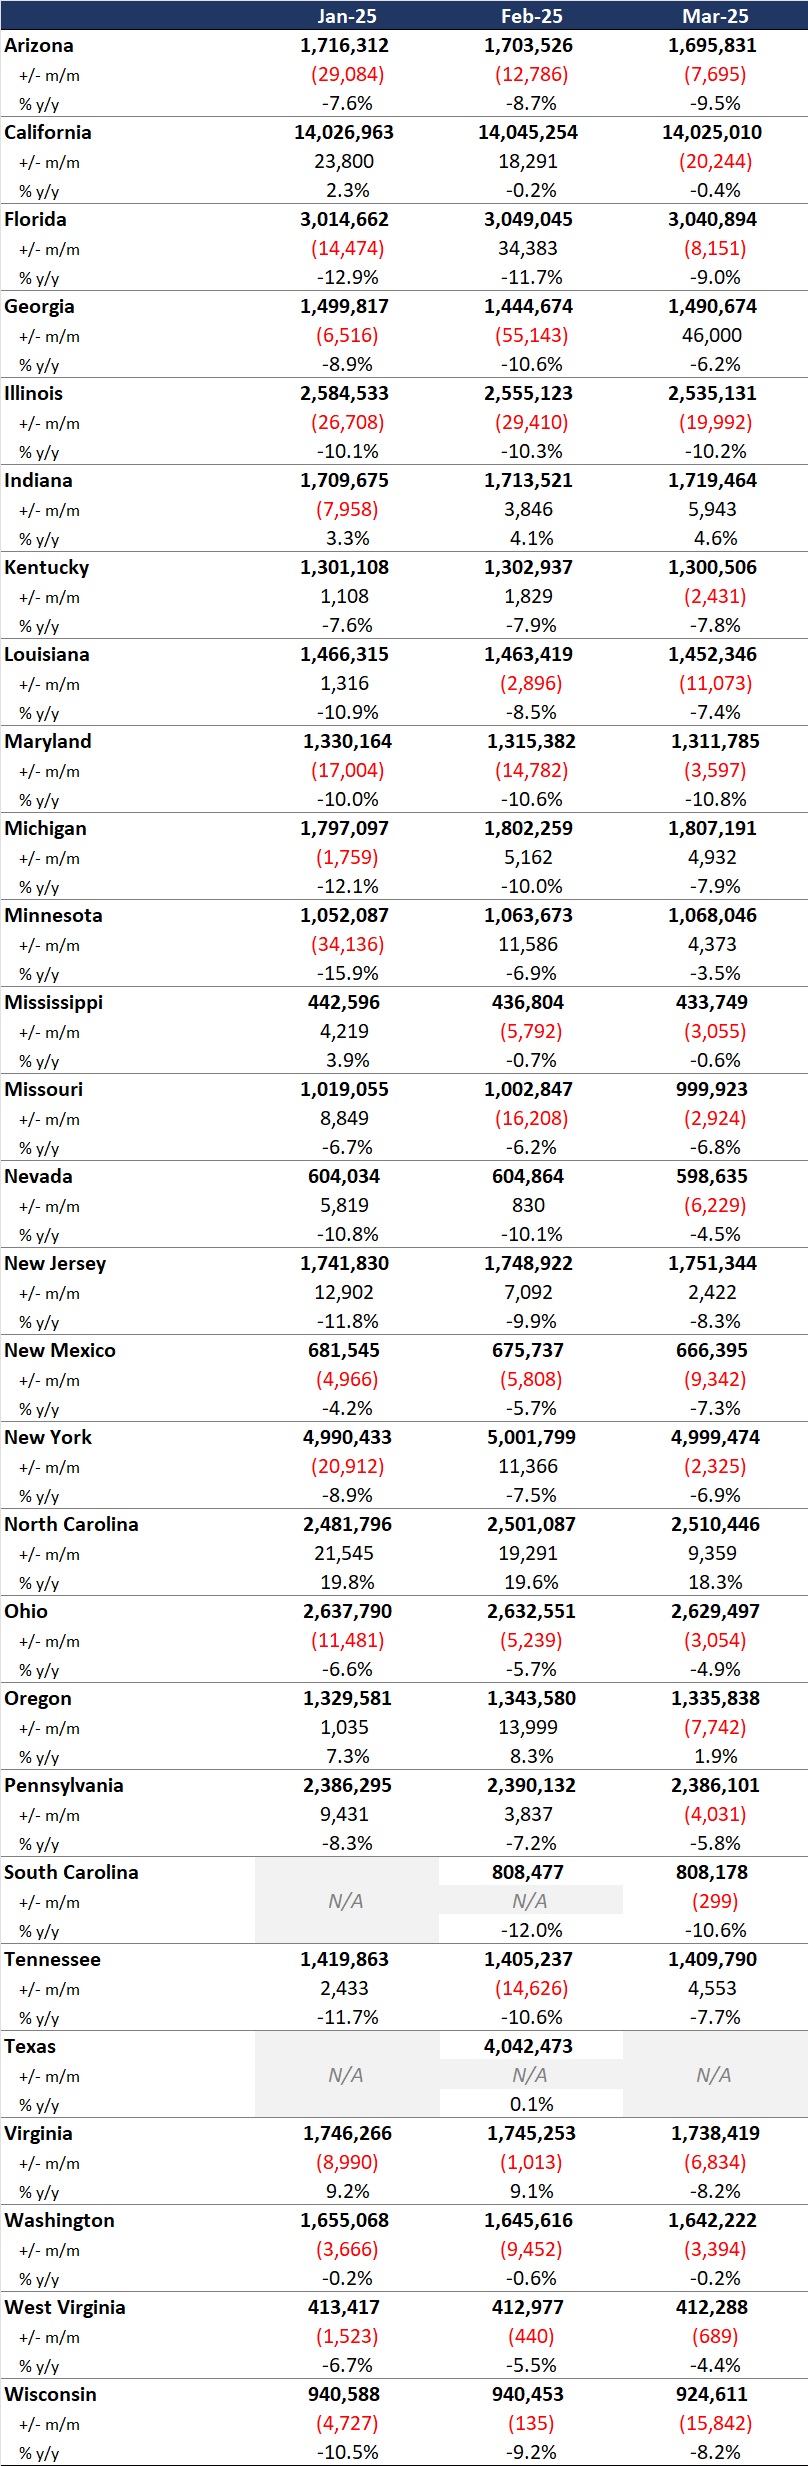
Table 1. Monthly MCO Enrollment by State, January 2025 through March 2025
Note: In Table 1 above and the state tables that follow, “+/- m/m” refers to the enrollment change from the previous month, and “% y/y” refers to the percentage change in enrollment from the same month in the previous year.
It is important to note the limitations of the data presented. First, states report the data at the varying times during the month. Some of these figures reflect beginning of the month totals, whereas others reflect an end of the month snapshot. Second, in some instances, the data are comprehensive in that they cover all state-sponsored health programs that offer managed care options; in other cases, the data reflect only a subset of the broader managed Medicaid population. This limitation complicates comparison of the data described above with figures reported by publicly traded Medicaid MCOs. Hence, the data in Table 1 should be viewed as a sampling of enrollment trends across these states rather than a comprehensive comparison, which cannot be established solely based on publicly available monthly enrollment data.
Market Share and Plan Dynamics
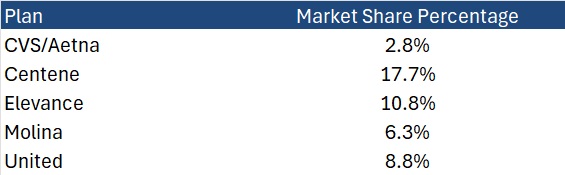
Using our data repository from 300 health plans across 41 states, HMAIS’s report addresses corporate ownership, program participation, and tax status. As of March 2025, Centene continues to lead with 17.7 percent of the national Medicaid managed care market, followed by Elevance (10.8%), United (8.8%), and Molina (6.3%), as Table 2 shows.
Table 2. National Medicaid Managed Care Market Share by Number of Beneficiaries for a Sample of Publicly Traded Plans, March 2025
What to Watch
The policy backdrop remains fluid. The US House of Representatives’ passage of the One Big Beautiful Bill Act introduces sweeping changes to Medicaid financing, including proposed cuts of up to $715 billion. Additional federal proposals, such as mandatory work requirements, could further reshape enrollment patterns.
Stakeholders should prepare for:
Implementation of work/community engagement mandates for certain adult populations
Potential redesign of Affordable Care Act expansion programs
Retraction of federal regulations focused on streamlining of eligibility and redetermination processes to improve accuracy and efficiency
Connect with Us
HMA is home to experts who know the Medicaid managed care landscape at the federal and state levels. As the Medicaid landscape continues to evolve, HMAIS equips stakeholders with timely, actionable intelligence. Our subscription service includes enrollment data, financials, waiver tracking, and a robust library of public documents.
For more information about the HMAIS subscription, contact our experts below.
[1] Arizona, California, Florida, Georgia, Illinois, Indiana, Kentucky, Louisiana, Maryland, Michigan, Minnesota, Mississippi, Missouri, Nevada, New Jersey, New Mexico, New York, North Carolina, Ohio, Oregon, Pennsylvania, South Carolina, Tennessee, Texas, Virginia, Washington, West Virginia, Wisconsin.
HMA focused this paper on how states disperse Medicaid funds to certain subpopulations within the program’s categorical eligibility infrastructure. A previous companion paper centered on increasing our understanding of Medicaid managed care spending by provider, offering more detail on the relative order of magnitude of the amounts spent on inpatient and outpatient hospital care, professional services, long-term care, pharmacy, and other health services.
As the latest national Medicaid managed care enrollment data show 75% of Medicaid beneficiaries were enrolled in comprehensive managed care organizations (MCOs), these two foundational papers illustrate the importance of developing a sound methodology to reliably estimate costs associated with MCOS. These papers, which are the first to present findings related to the development of the MCO methodologies, help lay the foundation for further work that will enable us to answer relevant questions, including:
How much do we spend on Medicaid patients with chronic conditions like asthma, diabetes, and hypertension?
How much do we spend on Medicaid patients receiving long-term services and supports (LTSS) and what is the unmet need?
How is Medicaid funding spent on childbirth and a child’s first year of life?
What are the opportunities to be more efficient and effective with Medicaid resources?
Our second In Focus section reviews the most recent Medicaid enrollment trends in capitated risk-based managed care programs in 29 states.[1] Health Management Associates Information Services (HMAIS) collected and analyzed monthly Medicaid enrollment data from the fourth quarter (Q4) of 2024.
The data offer a timely overview of trends in Medicaid managed care enrollment and valuable insights into state-level and managed care organization (MCO)-specific enrollment patterns. This information allows state governments, their partners, and other organizations interested in Medicaid to track enrollment shifts. Understanding the underlying drivers of enrollment shifts is critical for shaping future Medicaid policies and adjusting program strategies amid a dynamic healthcare landscape.
Overview of the Data
The 29 states included in our review have released monthly Medicaid managed care enrollment data via a public website or in response to a public records request from Health Management Associates (HMA). This report reflects the most recent data posted or obtained. HMA has made the following observations related to the enrollment data (see Table 1):
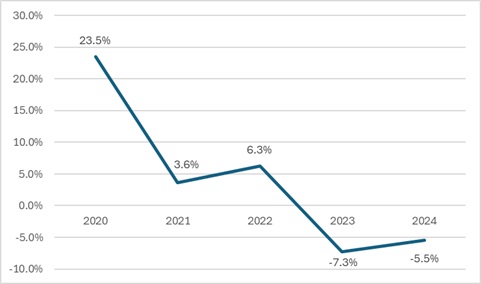
As of December 2024, across the 29 states tracked in this report, Medicaid managed care enrollment was 61.7 million, down by 3.6 million (-5.5%) year-over-year.
Though most states experienced declines in enrollment, six states saw enrollment increases as of December 2024—double the number of states from the previous year.
Figure 1. Year-Over-Year Medicaid Managed Care Enrollment Percent Change in Select States, 2020−24
Among the 22 expansion states included in this report, net Medicaid managed care enrollment has decreased by 2.1 million (-4%) to 49.5 million members at the end of Q4 2024, compared with the same period in 2023.[2]
Among the seven states included in this report that had not expanded Medicaid as of December 2024, net Medicaid managed care enrollment decreased by 1.5 million, or 1 percent, to 12.3 million members at the end of Q4 2024 compared with to the same period in 2023.
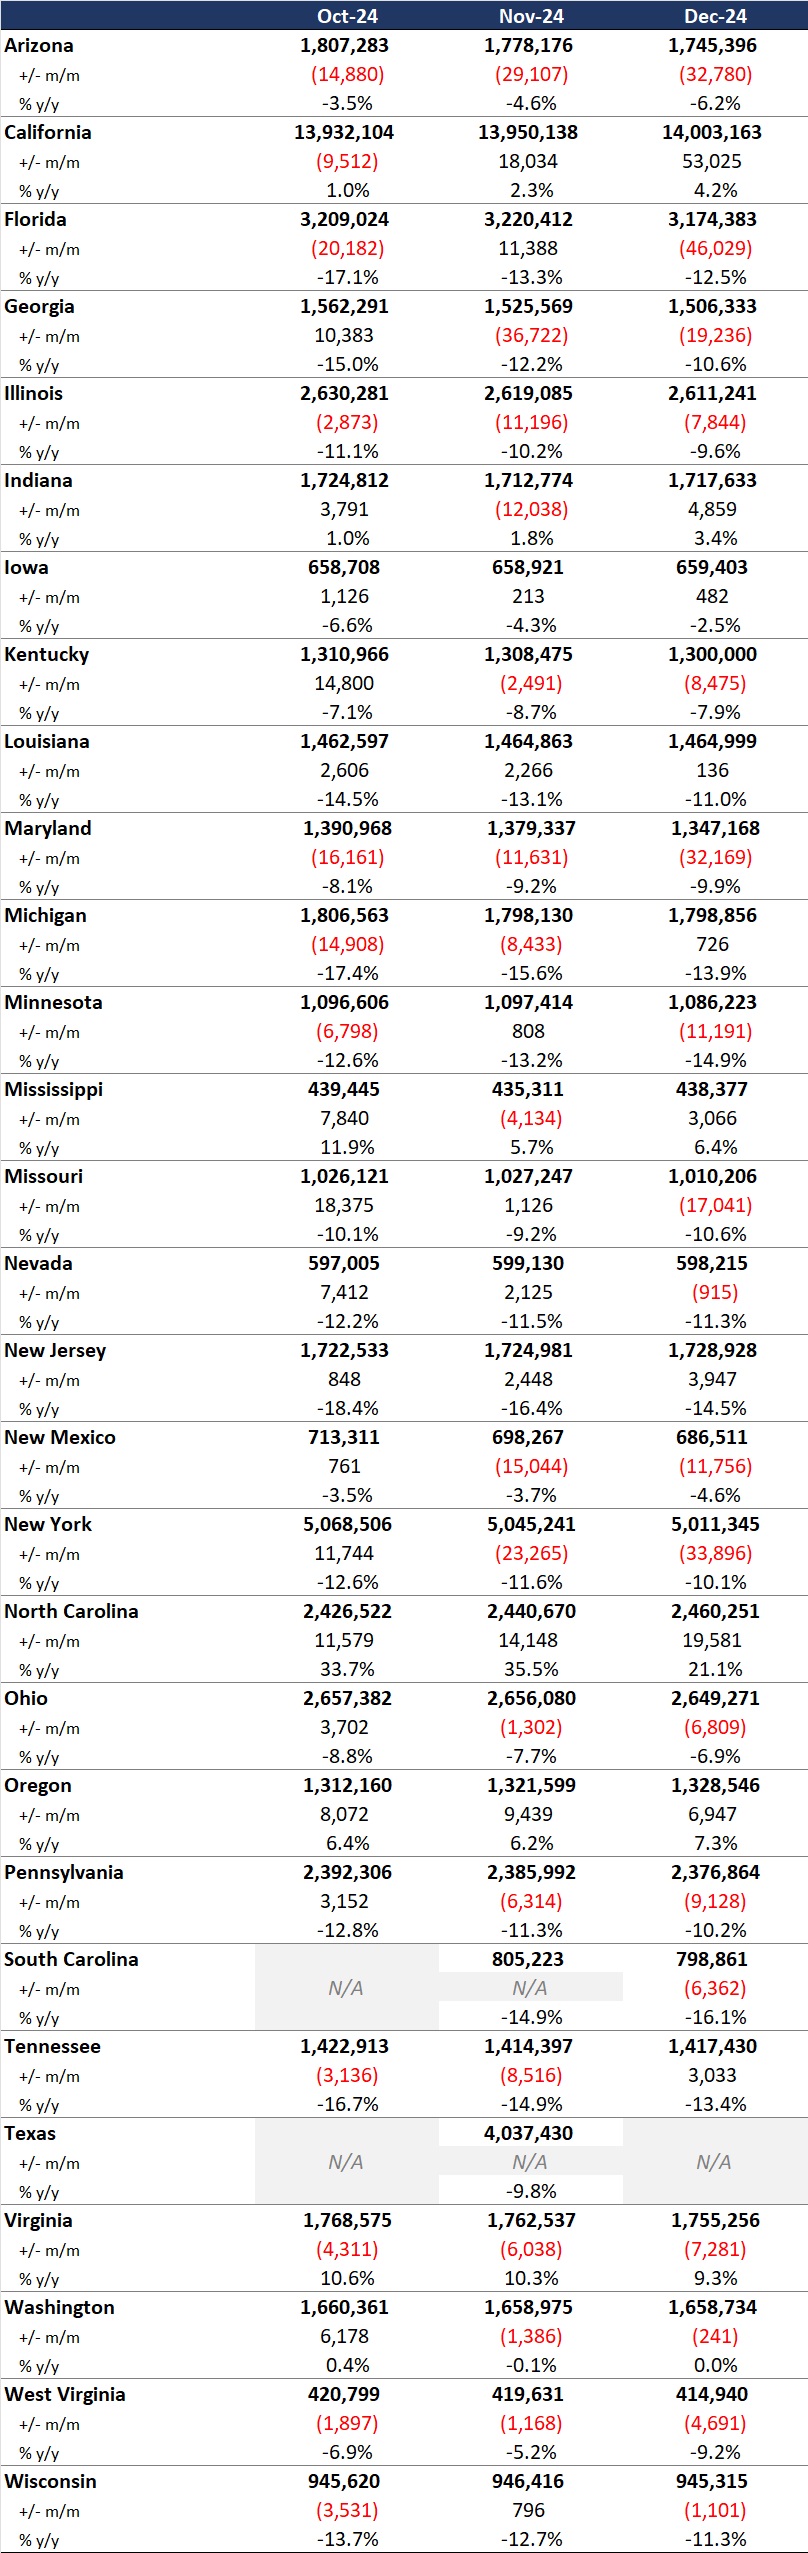
Table 1. Monthly MCO Enrollment by State—October through December 2024
Note: In Table 1 above, “+/- m/m” refers to the enrollment change from the previous month. “% y/y” refers to the percentage change in enrollment from the same month in the previous year.
It is important to note the limitations of the data presented. First, not all states report the data at the same time during the month. Some of these figures reflect beginning of the month totals, whereas others reflect an end of the month snapshot. Second, in some cases the data are comprehensive in that they cover all state-sponsored health programs that offer managed care options; in other cases, the data reflect only a subset of the broader managed Medicaid population. This limitation complicates comparison of the data described above with figures reported by publicly traded Medicaid MCOs. Hence, the data in Table 1 should be viewed as a sampling of enrollment trends across these states rather than as a comprehensive comparison, which cannot be established based solely on publicly available monthly enrollment data.
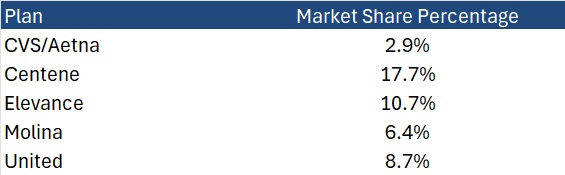
HMAIS also compiles a more detailed quarterly Medicaid managed care enrollment report representing nearly 300 health plans in 41 states. The report provides by plan enrollment plus corporate ownership, program inclusion, and for-profit vs. not-for-profit status, with breakout tabs for publicly traded plans. Table 2 shows a sampling of plans and their national market share of Medicaid managed care beneficiaries based on a total of 66.3 million enrollees. These data too should be viewed as a broader representation of enrollment trends rather than as a comprehensive comparison.
Table 2. National Medicaid Managed Care Market Share by Number of Beneficiaries for Sample of Publicly Traded Plans, 2024
What to Watch
Enrollment in Medicaid MCOs has experienced significant fluctuations recently, influenced both by policy changes and economic factors. Since April 2023, Medicaid enrollment has been on a downward trajectory as states complete eligibility redeterminations after the end of the COVID-19 public health emergency. This trend, coupled with financial and political challenges, necessitates strategic planning for stakeholders to navigate the evolving Medicaid landscape effectively.
Potential changes that may affect enrollment and require scenario and readiness planning include:
Federal requirement, or a new state option, to implement Medicaid work requirements for at least some categories of enrollees
Changes to the federal financial match policy, which may cause some states to make different decisions about their Affordable Care Act expansion program for adults
Modifications in requirements and expectations for more efficient eligibility processes to improve the accuracy of determinations and assignment to eligibility categories
Connect with Us
HMA is home to experts who know the Medicaid managed care landscape at the federal and state levels. The HMAIS subscription provides point-in-time and longitudinal Medicaid enrollment data, health plan financials, and additional actionable information about eligibility expansions, demonstration and waiver initiatives, as well as population- and service-specific information. HMAIS also includes a comprehensive public documents library containing Medicaid requests for proposals and responses, model contracts, scoring sheets, and protests.
For detail about the HMAIS enrollment report and subscription service, contact our experts below.
[1] Arizona, California, Florida, Georgia, Illinois, Indiana, Iowa, Kentucky, Louisiana, Maryland, Michigan, Minnesota, Mississippi, Missouri, Nevada, New Jersey, New Mexico, New York, North Carolina, Ohio, Oregon, Pennsylvania, South Carolina, Tennessee, Texas, Virginia, Washington, West Virginia, Wisconsin.
Notably, because of the timing of the draft notices and proposed rule, Trump Administration officials ultimately had more input into policies omitted from the rate notice and final policy rule than on policies that were finalized. For example, the final rule is exclusive of proposals to expand coverage for anti-obesity medications, guardrails for artificial intelligence (AI), and new requirements related to utilization management and prior authorization procedures.
In his confirmation hearing, CMS Administrator Mehmet Oz, MD, cited Medicare Advantage prior authorization practices and health risk assessments that lead to upcoding as areas that deserve further consideration and scrutiny, raising the potential for future regulatory shifts and even legislative reform. With the possibility of Medicare, including MA, facing cuts as part of broader budget negotiations in Congress, the rate notice and policy rule offer program stability counterbalancing the political and fiscal pressures that may emerge this year.
CMS has sought to stabilize MA and Part D programs into 2026, and stakeholders can benefit from understanding the impact in markets for 2026 and the signals of potential regulatory changes to come. For more in-depth analysis and insights on the rate notice, look for our policy and actuarial experts’ brief due out next week.
The remainder of this In Focus article reviews CMS’s decisions on major payment and policy proposals in the Rate Announcement and Final Rule and examines key considerations for healthcare stakeholders.
Payment Impact on Medicare Advantage Organizations
In the CY 2026 Rate Announcement, CMS projects that federal payments to MA plans will increase by 5.06 percent from 2025 to 2026, which represents a $25 billion increase in expected payments to MA plans next year. According to CMS, this represents an increase of 2.83 percentage points compared with the CY 2026 Advance Notice that is largely attributable to an increase in the effective growth rate. The increase in the effective growth rate—increasing to 9.04 percent in the Rate Announcement from 5.93 percent in the Advance Notice—is primarily the result of the inclusion of additional data on Medicare fee-for-service (FFS) expenditures, including payment data through the fourth quarter of 2024.
The Rate Announcement estimates represent the average increase in payments to MA plans and actual payments will vary from plan to plan. Below, Table 1 provides CMS estimates of the impact of finalized payment changes on net MA plan payments.
MA Risk Adjustment Changes
As expected, CMS finalized the last year of the three-year phase-in of the MA risk adjustment model, which requires calculating 100 percent of the risk scores using only the 2024 CMS-HCC (Hierarchical Condition Category) model in 2026. CMS also addressed stakeholder concerns with the planned transition toward a risk adjustment model based on MA encounter data, as previewed in the CMS CY 2026 Advance Notice. CMS pledged to engage stakeholders in this model development process while continuing to evaluate the feasibility, transparency, and timing of a future transition to an encounter-based risk adjustment model.
CMS also finalized the MA coding pattern adjustment factor of 5.9 percent for CY 2026, which is the statutory minimum adjustment factor to account for differences in coding patterns between MA plans and providers under Medicare FFS Parts A and B.
Part D Risk Adjustment
For CY 2026, CMS finalized the revised 2026 RxHCC model with adjustments for maximum fair price drugs. Importantly, CMS also finalized using separate FFS normalization factors for MA-Prescription Drug (MA-PD) plans and Prescription Drug Plans (PDPs), making 2026 the second year CMS will vary normalization for these two markets. The calculation of the factors for CY 2026 is different, however, and will have substantially greater impact than the method used previously. It also will reduce Part D risk scores significantly for MA-PD plans while increasing scores for PDPs.
MA Star Ratings
CMS continues to solicit feedback from stakeholders on ways to simplify and refocus MA Star Ratings measures to focus more on clinical care, outcomes, and patient experience of care measures. Also included in the CY 2026 Rate Announcement are non-substantive measure specification updates and a list of measures included in the Part C and Part D improvement measures and categorical adjustment index for the 2026 Star Ratings.
Separately, in the policy and technical changes rule, CMS finalized new regulatory requirements designed to enhance MA beneficiary protections in an inpatient setting, provisions related to allowable special supplemental benefits for the chronically ill (SSBCI), and the care experience for dually eligible beneficiaries enrolled in MA special needs plans.
Enhancing MA Beneficiary Appeal Rights and Notification Requirements
CMS is finalizing provisions that limit the ability of MA plans to reopen and modify a previously approved inpatient hospital decision on the basis of information gathered after the approval. Under the final rule, MA plans will be able to reopen an approved hospital admission only due to error or fraud. In addition, CMS finalized several provisions to enhance beneficiary appeal rights and new reporting and notice requirements, including:
Ensuring that MA appeals rules apply to adverse plan decisions, regardless of whether the decision was made before, during, or after the receipt of such services
Codifying existing guidance that requires plans to give a provider notice of a coverage decision
Ensuring enrollees have a right to appeal MA plan coverage denials that affect their ongoing source of treatment
Non-Allowable Special Supplemental Benefits for the Chronically Ill
The final rule establishes guardrails for SSBCI benefits by codifying a list of non-allowable examples (e.g., unhealthy food, alcohol, tobacco, life insurance). CMS did not finalize proposals that were designed to improve administration of supplemental benefits and enhance transparency of the availability of such benefits.
Improving Care Experience for Dual Eligibles
CMS finalized new requirements for dual eligible special needs plans (D-SNPS) that are applicable integrated plans (AIPs) as follows:
D-SNPs will be required to have integrated member ID cards for their Medicare and Medicaid plans
D-SNPs will be required to conduct an integrated health risk assessment for Medicare and Medicaid, rather than separate ones for each program.
These provisions affecting certain D-SNPS plans will be effective for the 2027 plan year.
Provisions Pertaining to the Medicare Part D Inflation Reduction Act
CMS is finalizing proposals to codify existing requirements related to key provisions of the Inflation Reduction Act, including no cost sharing for adult vaccines and capping monthly copayments for insulin at $35. In addition, CMS is codifying existing guidance related to the implementation of the Medicare Prescription Payment Plan, which is also part of the Inflation Reduction Act.
Key Proposals CMS Has Yet to Finalize
As noted earlier, CMS finalized a streamlined rule that excluded several regulatory changes identified in the November 2024 proposed rule. In addition to provisions related to coverage of anti-obesity medications, guardrails for AI, and mandatory analysis of the health equity impact of MA plans utilization management practices, the following proposals were not finalized. CMS notes that these proposals might be finalized in future rulemaking.
Expanding Medicare Part D Medication Therapy Management (MTM) eligibility criteria
Ensuring equitable access to behavioral health services by applying MA cost-sharing limits
Enhancing the Medicare Plan Finder to include information on plan provider directories
Promoting informed choice by enhancing CMS review of MA marketing and communication materials
Enhancing rules on MA plans’ use of internal coverage criteria
Key Considerations
The policies finalized in the CY 2026 Rate Announcement are projected to increase average Part C payments to MA plans by 5.06 percent in CY 2026—a significant uptick from the payment updates originally proposed in the CY 2026 Advance Notice. Nonetheless, the final rate increase will have varying effects across MA plans, with some experiencing larger or smaller impacts in CY 2026. MA plans should assess these outcomes as they prepare their bid submissions for 2026.
According to the CY 2026 Rate Announcement, CMS expects that the 5.06 percent increase will provide continued stability for the MA program and its beneficiaries while ensuring accurate and appropriate payments to Medicare Advantage organizations.
In the CY 2026 MA and Part D Final Rule, CMS adopted a significantly scaled-back final rule, which omitted some of the more far-reaching proposals for MA and Part D that were originally proposed in November 2024. CMS, however, could potentially revisit and finalize some of these proposals in future rulemaking. Moreover, new regulatory requirements that enhance enrollee protections in inpatient care settings and improving the care experience for dual eligibles signal CMS’s continued interest in improving program oversight and enhancing consumer protections for MA beneficiaries.
Connect With Us
MA stakeholders need to undertake scenario planning and be prepared to adapt to a rapidly evolving federal policy environment. From modeling and impact assessments of specific policy changes to strategy development and implementation, HMA is home to experts with diverse skill sets. Our team can help stakeholders assess and prepare for potential changes to prior authorization, looking holistically at their organization’s operations, patient care models, and reimbursement strategies. Our team also provides detailed modeling and assessments to ensure health plans are prepared for changes in risk adjustment and coding policies, supplemental benefits, and other key issues affecting capitation payment, bids, and care delivery models.
For details about the finalized payment and policy rules contact our featured experts below.
Medicare stakeholders are awaiting the imminent release of the Centers for Medicare & Medicaid Services (CMS) final Medicare Advantage and Part D rate notice and technical updates, as well as a final policy rule that establishes a significantly new direction for Medicare Advantage (MA) stakeholders. These final rules typically are released in April of each year.
In addition, the agency kicks off the annual cycle of payment rules for traditional fee-for-service Medicare, including the first wave of proposed rules that typically are released in April for the forthcoming payment year. These proposed rules for 2026 pertain to the following: Hospital Inpatient Prospective Payment System for Acute Care Hospitals, the Inpatient Rehabilitation Facility Payment System, the Home Health Payment System, and the Inpatient Psychiatric Facility Payment System. A second wave of 2026 proposed rules are typically released in July, including the Medicare Physician Fee Schedule and the Hospital Outpatient Prospective Payment System.
The MA rules and the first wave of Medicare Part A and Part B rules are highly anticipated regulations and now under review at the Office of Management and Budget. These rules are expected to be released in the coming days and weeks.
Why These Rules Matter
The rules set the rates for MA and reimbursement for a significant number of healthcare providers and facilities that serve Medicare beneficiaries. The rules also contain important information about CMS’s quality reporting programs and bonus payments and other changes required for Medicare stakeholders to ensure compliance.
What’s Different About 2025 Proposals
In the first year of a new presidential administration, CMS leaders have a limited window to include their policy priorities in the MA and Part D Final Rate Notice. CMS may, however, decline to finalize some or all of the prior administration’s proposals. Key issues that Health Management Associates (HMA), experts are watching for in the final rules include:
Whether CMS chooses to delay or not finalize significant policy changes proposed by the Biden Administration, including new requirements and guardrails around the use of prior authorization
Potential finalization of improvements to the Medicare plan finder
Direction on oversight of MA plan marketing activities
CMS decision and response to the proposal to expand coverage of anti-obesity medications under Medicare Part D and Medicaid
Similarly, in the first year of a presidential transition, CMS has a narrower opportunity to shape Medicare’s first set of proposed payment and policy rules. The agency may, however, begin to signal important policy direction on a global level and technical issues that can have an impact on Medicare stakeholders. HMA experts are watching in particular for requests for information and other signals of CMS’s Medicare priorities, including reforms in quality reporting, value-based contracting, pricing and contract transparency, among others.
Connect with Us
HMA’s expert consultants provide the advanced policy, tailored analysis, and operational skills you need to navigate today’s rapidly evolving regulatory landscape and to support implementation of final policies. Don’t let the uncertainty of future policies derail your strategic plans or burden your teams.
For details about the forthcoming Medicare Advantage and traditional Medicare regulations, contact one of our featured experts below.
Medicaid is a federal/state health insurance program that served more than 86 million lower-income people in fiscal year (FY) 2021. The combined federal and state spending for Medicaid totaled $717 billion that year, $420 billion of which was spent on providing care to Medicaid managed care organization (MCO) members, and $297 billion on services provided to fee-for-service enrollees.
While the role of managed care in Medicaid has grown tremendously over the past decade, with MCOs covering nearly three-quarters of Medicaid enrollees, detailed cost information has not been estimated for the people with MCO coverage. These data historically have been available only for fee-for-service (FFS) Medicaid because of limitations on federal data sources.
This lack of data blocks our understanding of the relative magnitude of the cost drivers in the program and contributes to an uninformed debate about policy reforms to control the growth of spending and improve quality of care.
Obtaining and using cost data by provider type for MCOs can help answer questions such as how much funding do MCO enrollees with diabetes, asthma, and/or hypertension consume? Of these patients, how many also have behavioral health conditions? How many MCO enrollees have six or more emergency department (ED) visits during a year and/or multiple inpatient hospital stays, and what does their resource consumption look like?
Health Management Associates (HMA) has developed a reliable methodology that can be applied to all 50 states, which approximates spending for the major categories of health services that MCOs cover, including: inpatient and outpatient hospital care, physician and other professional services, skilled nursing facilities, clinics, pharmaceuticals, and other services. HMA can determine prices for these services, which, combined with data on the number of encounters, yields reliable cost figures. These cost estimates will be useful in identifying unmet medical needs, gaps in our delivery systems, and areas of high spending where efficiencies and timely care management can be added to slow the growth in total health spending.