This week, our In Focus section reviews updated reports issued by the Department of Health & Human Services (HHS) Centers for Medicare & Medicaid Services (CMS) on Medicaid expansion enrollment from the “December 2017 Medicaid and CHIP Application, Eligibility Determination, and Enrollment Report,” published on April 30, 2018. Additionally, we review 2018 Exchange enrollment data from the “Health Insurance Marketplaces 2018 Open Enrollment Period: Final State-Level Public Use File,” published by CMS on April 3, 2018. Combined, these reports present a picture of Medicaid and Exchange enrollment at the beginning of 2018, representing more than 74 million Medicaid and CHIP enrollees and nearly 12 million Exchange enrollees.
Key Takeaways from Medicaid Enrollment Report
- Across all 50 states and DC, Medicaid and CHIP enrolled more than 74.4 million individuals as of December 2017.
- Medicaid and CHIP enrollment was flat since December 2016.
- From December 2016 to December 2017, three states saw double-digit percentage growth in Medicaid and CHIP – Alaska (15.5 percent); Montana (11.5 percent); and North Dakota (11.1 percent).
- During 2017, five states (Alabama, Hawaii, Massachusetts, North Carolina, and Texas) saw enrollment growth between 0 percent and 1 percent. Meanwhile, 25 states (Arizona, Arkansas, Colorado, DC, Florida, Idaho, Illinois, Indiana, Kansas, Maine, Mississippi, Missouri, New Jersey, New Mexico, Ohio, Oklahoma, Oregon, South Dakota, Tennessee, Utah, Vermont, Washington, West Virginia, Wisconsin, and Wyoming) saw enrollment decline across Medicaid and CHIP.
- Medicaid and CHIP enrollment is up nearly 16.6 million (28.6 percent) from the “Pre-Open Enrollment” period, defined as July 2013 through September 2013.
- The top five states in percentage growth of Medicaid and CHIP enrollment since the Pre-Open Enrollment period are Kentucky (109.8 percent), Nevada (92 percent), Montana (82.1 percent), Colorado (73.3 percent), Rhode Island (63.9 percent).
- The top five states in percentage growth of Medicaid and CHIP enrollment since the Pre-Open Enrollment period among states that did not expand Medicaid are North Carolina (28 percent), Idaho (24.1 percent), Tennessee (23.7 percent), Florida (16.3 percent), and Georgia (15.3 percent).
- The top five states in total enrollment growth of Medicaid and CHIP are California (4.34 million), New York (793,678), Ohio (715,463), Washington (657,751), and Florida (602,574).
Table 1 – Overall U.S. Medicaid/CHIP Enrollment Growth – Pre-Open Enrollment Monthly Average through December 2017
| Number of States | Pre-Open Enrollment Monthly Avg. (Jul13-Sep13) | Medicaid/CHIP Enrollment (Dec-17) | Dec-17 % Change | Dec-17 # Change | |
| Expanded Medicaid | 32 | 37,867,811 | 51,973,748 | 37.3% | 14,105,937 |
| Have Not Expanded | 19 | 20,000,576 | 22,459,122 | 12.3% | 2,458,546 |
| Total – All States | 57,868,387 | 74,432,870 | 28.6% | 16,564,483 |
Key Takeaways from 2017 Exchange Enrollment Report
- Final Exchange enrollments for the 2018 plan year, published in April 2018, showed Qualified Health Plan (QHP) plan selections of nearly 11.8 million across all 50 states and DC.
- 2018 QHP selections are down nearly 466,000 from 2017 QHP selections, a decline of 3.8 percent across all 50 states and DC.
- From 2017 to 2018, only one state saw double-digit percentage growth in QHP selections – Rhode Island (12.1 percent), a State-Based Marketplace (SBM).
- A total of 18 states saw declines in QHP selections between 0 percent and negative 5 percent. Another 15 states saw declines of negative 5 percent to negative 10 percent. A total of four states saw double-digit percentage declines in QHP selections from 2017 to 2018.
- Overall, the 13 states with SBMs saw no growth from 2017 to 2018, while all other Exchange/Marketplace administration models saw declines in enrollment.
Table 2 – Overall U.S. Exchange QHP Selection Growth – 2017 through 2018
| Marketplace Model (as of 2018) | Number of States | Selected Exchange QHP (2017) | Selected Exchange QHP (2018) | QHP % Change | QHP # Change |
| State-Based Marketplace (SBM) | 13 | 3,095,353 | 3,096,102 | 0.0% | 749 |
| State-Based Marketplace – Federal Platform (SBM-FP) | 4 | 318,082 | 316,699 | -0.4% | (1,383) |
| Federally Facilitated Marketplace (FFM) | 21 | 7,132,705 | 6,746,030 | -5.4% | (386,675) |
| Partnership Marketplace | 7 | 914,484 | 851,718 | -6.9% | (62,766) |
| Plan Management | 6 | 755,379 | 739,626 | -2.1% | (15,753) |
| Total | 12,216,003 | 11,750,175 | -3.8% | (465,828) |
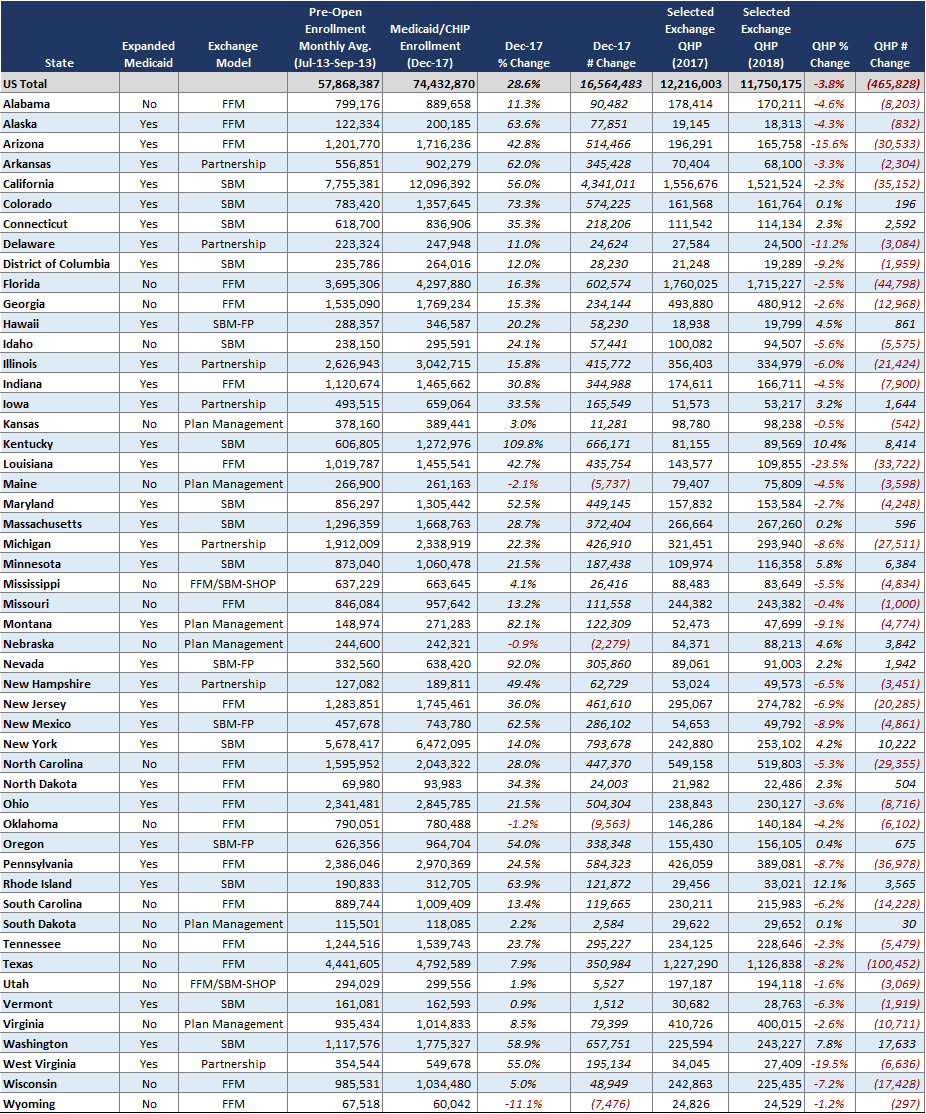
Table 3 – Medicaid/CHIP Enrollment Growth Across All States (December 2017) and Final 2018 Exchange Enrollment (April 2018)
Medicaid and Exchange Enrollment Data Sources
Link to CMS Medicaid Expansion Enrollment Report:
Link to CMS Marketplace Open Enrollment Period Public Use Files:
“2018 Marketplace Open Enrollment Period Public Use Files” (April 3, 2018)