On February 11, 2026, the Congressional Budget Office (CBO) released The Budget and Economic Outlook: 2026 to 2036 report. The publication, which represents the first time CBO has released Medicare and Medicaid spending baseline projections since January 2025, reflects the impact of the 2025 Budget Reconciliation Act (P.L. 119-21, OBBBA), recent changes to Medicare reimbursement for skin substitute products, and the latest Medicare Part D and Medicare Advantage bids.
CBO’s baseline serves many functions, including serving as the official “scorekeeping” benchmark used for cost estimates of proposed legislation under consideration in Congress.
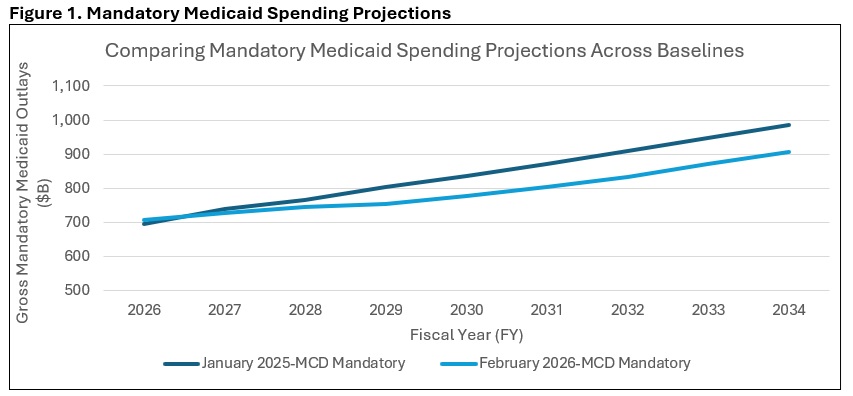
Changes to CBO’s Medicaid Baseline
CBO decreased its projections of 2026–2035 Medicaid mandatory outlays by approximately $514 million from its January 2025 baseline update. The main driver of that reduction is the impact of the Medicaid provisions in the 2025 Budget Reconciliation Act, which CBO expects will reduce total Medicaid enrollment by 13.1 million people in 2035. The drop in Medicaid spending from the OBBBA-related enrollment reductions was partially offset by technical changes CBO made to the Medicaid baseline.
Medicaid costs per enrollee grew by 16 percent in 2025, which was more than CBO had anticipated. The agency attributes the cost per enrollee growth to a reported decrease in the average health status of Medicaid enrollees following the end of the COVID-era continuous eligibility policy.
CBO anticipates that payment rates for Medicaid managed care plans will begin to rise in 2026 because of this decrease in the average health status of enrollees, and the agency has updated the Medicaid baseline accordingly (see Figure 1).
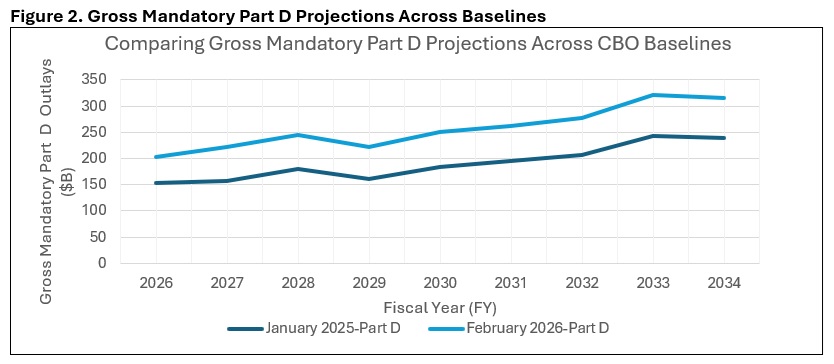
Compared with its January 2025 baseline, CBO increased its projections of Medicare’s 2026–2035 mandatory outlays by about $1 trillion (roughly $942 billion, by Health Management Associates (HMA) calculations). The main driver of that increase came from CBO’s updates to its Medicare Part D spending projections, which were increased to reflect higher than expected 2026 bids from private insurance plans that administer the Part D benefit. According to their 2026 bids, Part D plans anticipate a 35 percent increase in their annual per enrollee costs in 2026—a trend that CBO was not expecting and wants to study further. Part D spending per beneficiary in 2035 is now projected to exceed $4,000, up from less than $3,000 in the January 2025 baseline (See Figure 2).
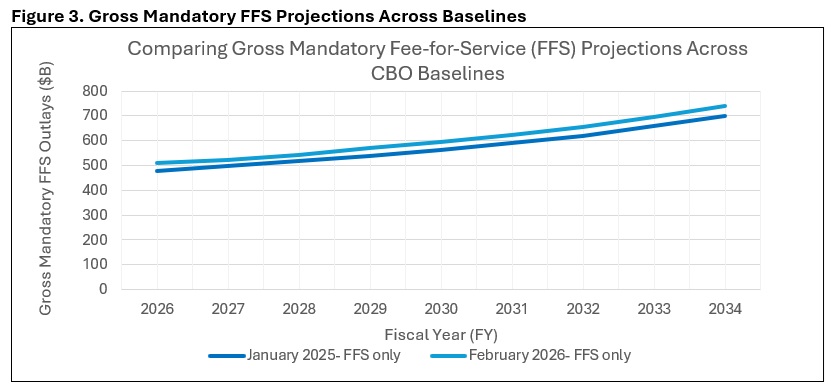
The agency’s Medicare Part A fee-for-service (FFS) spending projection increase was the result of larger than expected increases in 2025 enrollment and per enrollee spending. Those trends were also seen in Medicare Part B FFS but were partially offset by the Centers for Medicare & Medicaid Services’s (CMS) recent reimbursement changes to skin substitute products. Overall, CBO estimates that the skin substitute reform issued in CMS’s Medicare Physician Fee Schedule (MPFS) and Outpatient Prospective Payment System (OPPS) CY 2026 final rules will save $245 billion over the 2026–2035 period, including the effects on the Medicare Advantage (MA) program (see Figure 3).
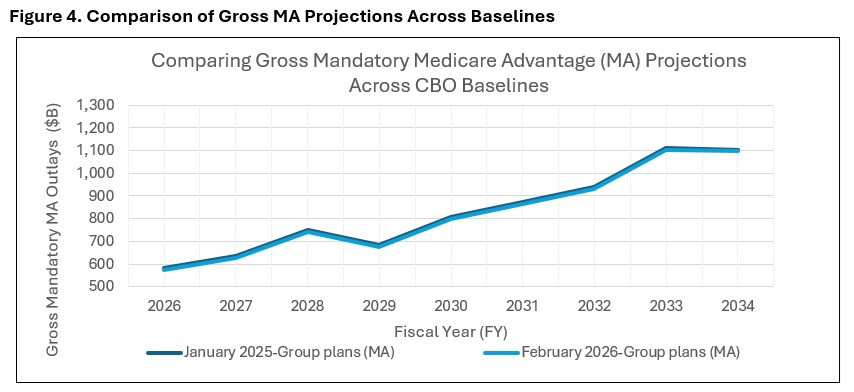
Finally, CBO reduced its spending projections for MA compared to the January 2025 baseline. This change was made to reflect lower-than-expected Medicare Advantage enrollment in 2025, although the spending implications of lower enrollment were partially offset by higher-than-expected bids in 2026 by providers of MA plans (see Figure 4).
Interested in understanding how CBO’s latest baseline update affects the federal budgetary implications of certain Medicare or Medicaid policy topics or proposals? Contact our experts, Mark Desmaris and Rachel Matthews, to learn more about HMA’s “CBO-style” federal budgetary scoring work, which relies on The Moran Company’s long-standing methodology. [1]
Beyond federal budget scoring, HMA is working with states, health plans, and providers to assess how changes in enrollee health status are affecting utilization, costs, and payment rates—and what those trends may mean for Medicaid and MA organizations and providers. Our teams support states in evaluating managed care rate setting and program design, help Medicaid and MA plans anticipate risk and bid implications, and assist providers in understanding how changes in patient acuity could affect care delivery, contracting, and financial performance.
[1]Specifically, we apply our understanding of CBO precedents to predict how CBO will likely evaluate the budgetary impact of the legislation in question. We use our best judgment to adopt the assumptions CBO would tend to use, with the understanding that any variance in the assumptions CBO ultimately adopts could cause our estimate to differ from theirs.
This week, our In Focus section highlights findings from a Health Management Associates Information Services (HMAIS) analysis of the Centers for Medicare & Medicaid Services (CMS) preliminary CMS-64 Medicaid expenditure report for federal fiscal year (FFY) 2025. The data show total medical services expenditures reached $971.4 billion across all states and territories, up 6.9 percent from FFY 2024.
This CMS-64 spending detail provides important context as states prepare for their upcoming legislative sessions and begin implementing changes required under the 2025 budget reconciliation act (P.L. 119-21, OBBBA). Early fiscal and operational pressures will stem from changes to the Supplemental Nutrition Assistance Program (SNAP) and preparations for community engagement requirements for Affordable Care Act (ACA) Medicaid expansion enrollees. In subsequent years, pressures will intensify because of major changes to provider tax financing and new federal limits on state directed payments in 2027 and early 2028.
In this article, we provide a deeper review of Medicaid spending, including the federal-state financing split. As Medicaid agencies prepare for upcoming spring sessions and anticipate potential program changes under OBBBA, it is notable that nearly two-thirds of Medicaid directors report an at least fifty percent likelihood of a Medicaid budget shortfall in FFY 2026.
Growth and Drivers in Medicaid Managed Care Spending
The HMAIS analysis looks at CMS-64 preliminary estimates of Medicaid spending by state for FFY 2025. CMS tracks state expenditures through the automated Medicaid Budget and Expenditure System/State Children’s Health Insurance Budget and Expenditure System (MBES/CBES).
While enrollment decreased for most states following the COVID-19 public health emergency unwinding, states saw an uptick in expenditures due to increased state directed payments, greater utilization and sicker populations, higher drug costs, increased provider rates, and greater use of long-term services and supports and behavioral health.
Key findings from HMAIS’ analysis (see Table 1), include:
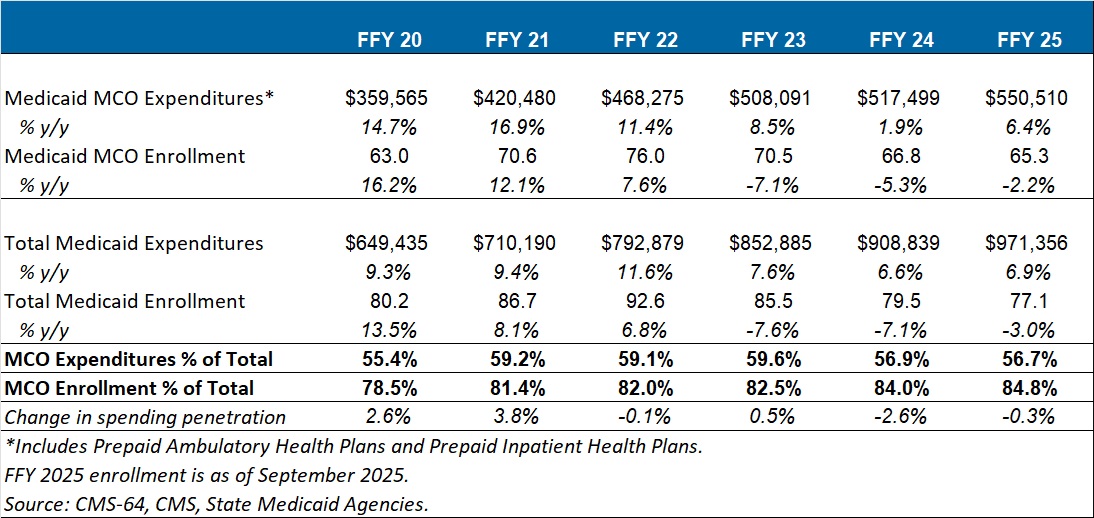
Total Medicaid managed care spending (federal and state share combined) reached $550.5 billion in FFY 2025, up from $517.5 billion in FFY 2024.
This amount represents a 6.4 percent year-over-year increase from FFY 2024 to FFY 2025.
Managed care accounted for 56.7 percent of total Medicaid spending in FFY 2025, down 0.3 percentage points from the previous year.
The $33 billion increase from FFY 2024 to FFY 2025 exceeds the $9.4 billion increase seen the year prior, reflecting renewed growth following the unwinding transition period.
These figures include spending on comprehensive risk-based managed care organizations (MCOs), prepaid inpatient health plans (PIHPs), and prepaid ambulatory health plans (PAHPs). PIHPs and PAHPs refer to prepaid health plans that provide a subset of services, such as dental or behavioral health care. This total is exclusive of fee-based programs such as primary care case management models.
Table 1. Medicaid MCO Expenditures as a Percentage of Total Medicaid Expenditures, FFY 2020–2025 (in millions)
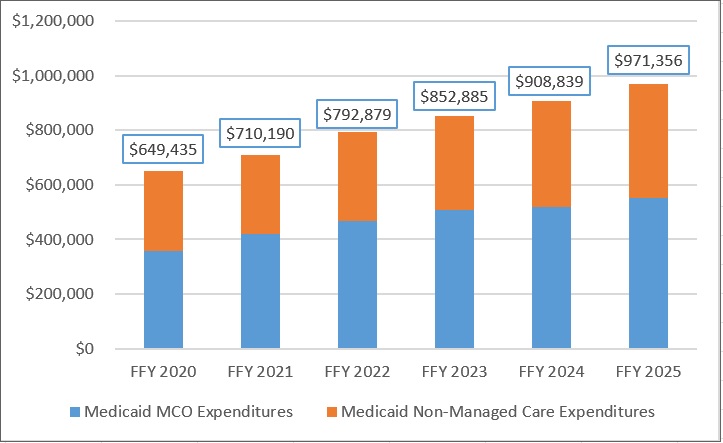
Annual Medicaid managed care expenditures have grown consistently with total Medicaid expenditures. After slower growth in FFY 2024—which aligned with the post-COVID-19 policy unwinding period when many states completed eligibility redeterminations—FFY 2025 again experienced an uptick in managed care growth (see Figure 1).
Figure 1. Total and MCO Medicaid Expenditures, FFY 2020–2025 ($M)
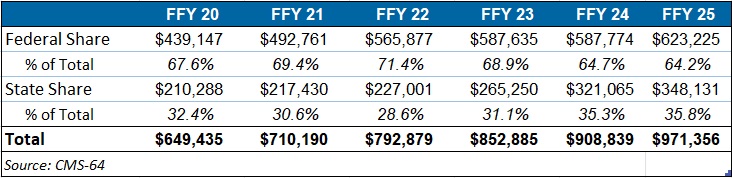
Federal versus State Share Spending
The preliminary FFY 2025 expenditure data provides a baseline before OBBBA’s changes are scheduled for implementation and as states continue to face Medicaid funding challenges. In FFY 2025, federal funding accounted for 64.2 percent of FFY 2025 spending, and non-federal matching funds accounted for 35.8 percent (see Table 2). Particularly later in 2027, 2028, and subsequent years, Medicaid expansion states stand to see disproportionally larger increases in their share of spending.
Table 2. Federal versus State Share of Medicaid Expenditures, FFY 2020–2025 (in millions)
T-MSIS Data Adds Detail to CMS-64 MCO Spending
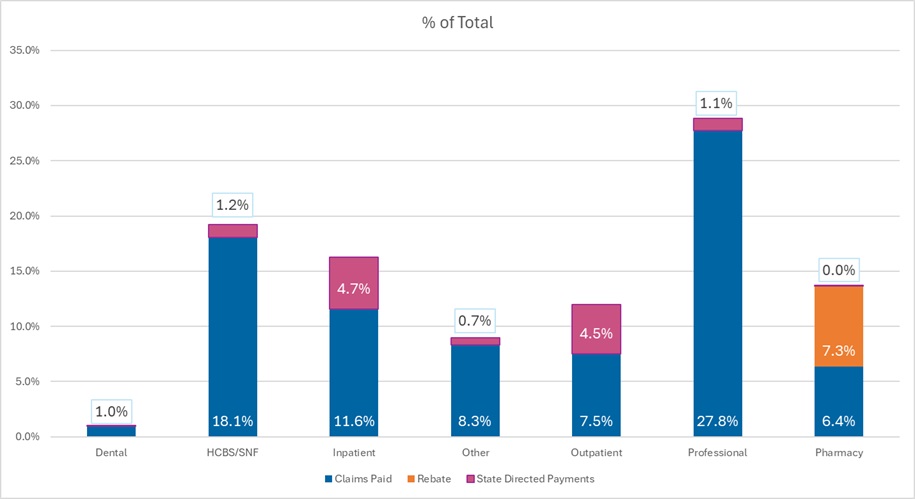
To complement CMS-64 macro-spending trends, HMA developed a methodology allowing us to use Transformed Medicaid Statistical Information System (T-MSIS) data to approximate managed care spending by service category. Although T-MSIS enables more granular views (e.g., professional services, inpatient/outpatient hospital services, skilled nursing facilities (SNFs), HCBS, clinics, pharmaceuticals), the most recent dataset typically lags one to two years behind CMS-64 totals.
HMA’s analysis of the T-MSIS data shows that while managed care remains the dominant delivery system model for Medicaid, spending by provider types helps contextualize the CMS-64 report. Notably, the CMS-64 reports FFY25 data and our report below on T-MSIS disaggregation uses 2023 data. Although the T-MSIS and CMS-64 data are for different years, it still highlights the main components of the largest spending component of the CMS-64 with more recent data.
The 2023 T-MSIS analysis shows the following:
Professional fees are the lead spending category, with nearly 30 percent of spending directed toward payments to physicians and other practitioners (e.g., physician assistants, nurse practitioners). Given that T-MSIS data are built around billing codes, services that traditionally may be considered part of a bundled rate (i.e., a large portion of physician services delivered in hospitals and clinics) are essentially unbundled and considered professional fees.
Hospital spending (inpatient plus outpatient), SNF costs, and professional fees together account for close to 75 percent of spending in CY 2023.
Figure 2. T-MSIS Medicaid Spending by Service Category 2023 (MCO disaggregated plus FFS)
What to Watch
Because Medicaid is such a big part of state government spending, outlays for Medicaid will always be a focus and challenge for states. Upcoming state legislative sessions and OBBBA driven changes will begin in 2026 with SNAP pressures and major operational preparations for community engagement requirements for expansion states. Preparations for new limits on provider taxes and state directed payments will likely begin immediately, but the true impacts will occur in 2027 and early 2028. States will need to tailor their programs under funding constraints.
Connect with Us
HMAIS, a subscription-based tool that Health Management Associates offers, provides state-by-state analysis of the CMS-64 data, Medicaid managed care enrollment trends, and state budget reporting. For more information about an HMAIS subscription, contact Andrea Maresca and Alona Nenko. For details on T-MSIS data, contact Matt Powers and Shreyas Ramani.
Health Management Associates (HMA) recently co-hosted a policy forum with the Massachusetts Association of Health Plans (MAHP), entitled Advancing Better Outcomes: How the One Care and SCO Programs Improve Health for Older Adults and People with Disabilities on Medicare and Medicaid. More than 100 key decision makers from MassHealth (Medicaid), health plans, providers, community-based organizations, and advocacy organizations attended the conference, elevating the value of the MassHealth One Care and Senior Care Options (SCO) programs to dually eligible individuals. The policy forum also provided an important opportunity for state legislators and their staff to learn about these complex programs.
MassHealth One Care and SCO Programs
Massachusetts’ One Care and the SCO programs currently serve more than 125,000 individuals covered under MassHealth and Medicare, also known as dually eligible individuals. One Care is a population-specific program for dually eligible adults 21-64 years of age. SCO is a population-specific program for dually eligible older adults 65 and older, tailored to the needs of older adults. The One Care and SCO programs serve individuals with complex chronic conditions and disabilities, including mental health and substance use disorder needs, and high home-and-community-based service (HCBS) needs. The One Care and SCO programs advance independent living, recovery, and community living goals. Approximately 99 percent of One Care enrollees, and 95 percent of SCO enrollees, live in the community.
In addition to creating the forum in partnership with MAHP, HMA shared its national and state policy expertise and local market insights with attendees during a series of presentations. HMA outlined ways in which the One Care and SCO programs offer more value to dually eligible individuals than the state’s fee-for-service (FFS) system.
The event focused on three key topics:
The national landscape for Medicare-Medicaid integrated care programs.
The value of the One Care and SCO programs and the role that health plans play in improving outcomes for adults who are eligible for both Medicare and Medicaid (“dually eligible”), and
Key Takeaway #2. The Massachusetts One Care and SCO programs provide significant value to dually eligible individuals in Massachusetts.
The One Care and SCO programs provide significant value to enrollees. As compared to FFS, Medicaid-Medicaid integrated care programs like One Care and SCO provide care coordination, a personal care plan, bundling prescriptions through a single provider, and other services.
Many forum attendees pointed out that the One Care program is one of the most advanced integrated care programs in the nation. One Care’s success is tied in part to the active and critical role that the One Care Implementation Council plays in shaping program policy. For more than a decade, the One Care Implementation Council and MassHealth have worked in partnership to improve the program. As shared by the Massachusetts Medicaid Policy Institute (MMPI): “The Commonwealth intends to preserve the Implementation Council’s role in the next phase of One Care, and to continue engaging the council as an essential partner in policy and program change, monitoring, and oversight.”
Key Takeaway #3. Over the last two decades, SCO and One Care plans have established many innovations.
The forum highlighted many innovations in these programs, from primary and urgent home care to place-based supports. It also provided an opportunity to talk about the important role and commitment that the plans have in emergency situations to ensure that members are safe in the face of a community crisis.
Panelists see many opportunities for plans to continue to evolve and improve outcomes and equity. For example, the One Care program has significant opportunities to address the behavioral health needs of dually eligible adults. Dually eligible adults with mental health and/or substance use disorder diagnoses are at higher risk of an emergency department visit and inpatient stay than other enrollees. Health plan per member per month (PMPM) spending on inpatient services for those with a behavioral health condition is much higher as a share of the total PMPM than other populations. The HMA data pointed to a need for further innovation in the mental health arena to advance better outcomes of quality of life and costs.
Key Takeaway #4. Conference attendees focused on the importance of addressing enrollees’ social determinants of health needs.
Many One Care and SCO eligible individuals are often just one unmet health related social need away from the risk of hospitalization or institutionalization. Other attendees underscored the risk that enrollee living situations and recovery can become instantly unstable due to the death of an important family member. One aging leader described her role as “triaging risk.” Other leaders from the disability community urged plans to use z codes to improve plan and provider attention to identify and address the SDOH needs.
Looking Ahead
As Massachusetts prepares for the 2026 One Care and SCO contract year, the forum underscored the progress made over the past decade and the opportunities ahead to improve care coordination, collect z codes, and invest in outcomes-driven partnerships. Massachusetts is well-positioned to continue leading the nation in designing integrated care programs that improve health and support community living for older adults and people with disabilities.
HMA looks forward to supporting all organizations including state Medicaid programs and health plan and provider associations as they convene stakeholders to improve their integrated care programs. Our expertise includes program planning, strategy and implementation, technical support and evaluation, and state-specific knowledge to make projects successful. Please contact Ellen Breslin, Rob Buchanan, and Julie Faulhaber for more information on how HMA can help your organization.
Summary Facts About the One Care and SCO Programs
The One Care and SCO programs are population-specific programs, serving more than 125,000 individuals with MassHealth plus Medicare coverage. MassHealth designed the One Care and SCO programs around the specific needs, preferences and goals of adults and older adults.The One Care program enrolls dually eligible adults with disabilities, ages 21-64 at the time of enrollment, covered under MassHealth Standard or CommonHealth and Medicare (Parts A and B, and eligible for Part D). Enrollees in One Care have multiple chronic conditions and disabilities including significant mental health and substance use disorder needs. The SCO program enrolls dually eligible adults ages 65 and older, covered under MassHealth Standard and Medicare (Parts A and B, and eligible for Part D). SCO enrollees have significant chronic conditions, many of which are associated with aging.
MassHealth launched the SCO program in 2004 and One Care in 2013. The One Care program currently operates as a Financial Alignment Initiative (FAI) demonstration. The One Care and the SCO programs combine MassHealth & Medicare benefits into a single plan with one card and one care team. One Care covers medical, mental health, and prescription medications, plus support for daily tasks and independent living and recovery. Care coordinators help members stay healthy and get the services they need.
The One Care and SCO Programs Continue to Evolve. The FAI demonstration authority ends in 2025. Massachusetts will shift from the demonstration to a Fully Integrated Dual Eligible Special Needs Plan (FIDE-SNP) structure. The SCO program currently operates as a FIDE SNP model. The state reprocured the One Care and SCO plan network. The state selected five One Care plans and six SCO plans. New contracts for One Care and SCO plans start January 1, 2026.The new contracts create several changes including changes in eligibility for the program and enrollment processes, benefits, and financial payment provisions.
The Centers for Medicare & Medicaid Services (CMS) last month issued a letter to states providing preliminary guidance on Medicaid State Directed Payments (SDPs), which outlines new federal payment limits, clarifies grandfathering provisions, and signals significant changes ahead for Medicaid financing and policy. The letter is part of CMS’s implementation of Section 71116 of the Budget Reconciliation Act of 2025 (OBBBA, P.L. 119-21)—the portion of the legislation that focuses on curbing SDP spending and reinforcing program integrity.
Though CMS describes the guidance as preliminary, it is the view of Health Management Associates (HMA) experts—including former state officials, actuaries, and policy strategists—that it signals directionally new policy for Medicaid agencies, managed care organizations (MCOs), and providers. CMS is working on two proposed SDP-related regulations, which are in the final stages of federal review. The preliminary guidance and forthcoming rules will likely reflect long-standing concerns for several years, even over shifting congressional control and multiple presidential administrations.
This article addresses key clarifications in the letter; the impact of the preliminary guidance on states, MCOs, and providers; and how the directive may influence Medicaid budgets, financing strategies, and future policy reforms.
Guidance Clarifies Timeframes for SDPs
Grandfathering Limited to Specific Rating Periods
CMS will allow states to maintain SDP spending amounts, up to the average commercial rate ceiling, that were in place for state fiscal year (SFY) 2025, calendar year (CY) 2025, and SFY 2026 rating periods. Nonetheless, new or expanded SDPs above Medicare equivalent levels in expansion states and 110 percent of Medicare in non-expansion states—even those based on legislation passed in 2025—are ineligible for grandfathering if they apply to rating periods starting after July 4, 2025. These grandfathered spending amounts will need to phase down with rating periods beginning on or after January 1, 2028.
Preliminary Grandfathering Determinations
CMS has begun notifying states whether a preprint is “likely eligible” for grandfathering. Because these are preliminary determinations, states should prepare for further review and revisions.
Submission Cutoff Date Clarified
In response to confusion around the May 1, 2025, submission deadline, CMS clarified that July 4, 2025, is the cutoff for grandfathering eligibility, provided the state fully completed the preprint. States may have rushed to meet a July 4 submission deadline and may have left questions on the preprint unanswered. In these instances, it is possible—if not likely—that CMS will consider the application incomplete and thus ineligible for grandfathering. Since this is a developing area with limited precedent, states may still seek clarification or reconsideration, though CMS has not yet issued definitive guidance or a formal process for resolving these situations.
No Increases Allowed Until 2028
States are prohibited from increasing the total dollar amount of grandfathered SDPs—the “expected spend”—until January 1, 2028. This restriction limits flexibility for states to expand their programs and may require that they reassess their SDP strategies. For example, using percentage-based calculations tied to average commercial rates, will no longer capture year-to-year growth because of utilization or acuity changes.
10 Percent Phasedown Unaddressed
CMS has yet to provide official guidance on the 10 percent phasedown of SDPs. Stakeholders remain in a holding pattern, awaiting a forthcoming proposed rule that will clarify how reductions will be calculated.
What It Means for States and Healthcare Organizations
SDPs have become a critical tool for states to stabilize provider networks through increased Medicaid reimbursement. This authority will be significantly limited, and states will need to reduce many existing programs. Medicaid enrollment losses resulting from other Medicaid policy changes, such as work requirements and minimum semiannual redetermination, will likely compound the strain on provider payments.
Providers and states need to start planning for these losses in revenue now. Strategic planning for SDP sustainability and close monitoring of upcoming CMS rulemaking is essential.
While the guidance imposes constraints, it also opens the door for policy innovation. For example, some states may use this moment to reform Medicaid financing, streamline supplemental payments, and reconfigure provider incentives to better reflect quality and access, advancing value-based care goals and achieving total cost of care savings through efficiency and aligned incentives.
Connect with Us
HMA is uniquely positioned to support states, MCOs, and providers as they navigate the evolving landscape of Medicaid SDPs. Our team includes former state Medicaid directors, actuaries, and policy strategists with deep expertise in designing sustainable financing arrangements and guiding public engagement processes. We bring robust modeling capabilities to clients seeking to assess the financial impact of CMS’s new restrictions, including the 10 percent phasedown and interactions with provider tax limitations. Our experts are actively engaged with CMS and understand how to translate federal guidance into actionable strategies that align with state goals and operational realities.
Whether revising preprint submissions, evaluating quality frameworks, or rethinking provider incentives, HMA delivers the technical and policy insight needed to move forward with confidence.
For questions about the federal guidance and considerations for your organization, contact our experts below.
This week, our second In Focus provides insights into Medicaid managed care enrollment in the second quarter of 2025. Health Management Associates Information Services (HMAIS) obtained and analyzed monthly Medicaid enrollment data in 30 states,[1] offering a reliable baseline and timely view of the immediate impact of the current policy landscape as new federal policies take effect.
This analysis presents a snapshot of HMAIS’s comprehensive detailed quarterly Medicaid managed care enrollment report (available by subscription), which includes plan-level information for nearly 300 health plans in 41 states, corporate ownership, for-profit versus not-for-profit status, and similar information regarding publicly traded plans. Table 1 provides a sample of enrollment trends, representing 57 million Medicaid managed care enrollees of a total of 66 million Medicaid managed care enrollees nationwide. Data reporting periods and program coverage vary by state, so figures may not be fully comparable.
Key Insights from 2Q25 Data
The 30 states included in our review have released monthly Medicaid managed care enrollment data—via a public website or in response to a public records request from HMAIS—for April through June of 2025. This report reflects the most recent data posted or obtained from states. HMA has made the following observations regarding the enrollment data:
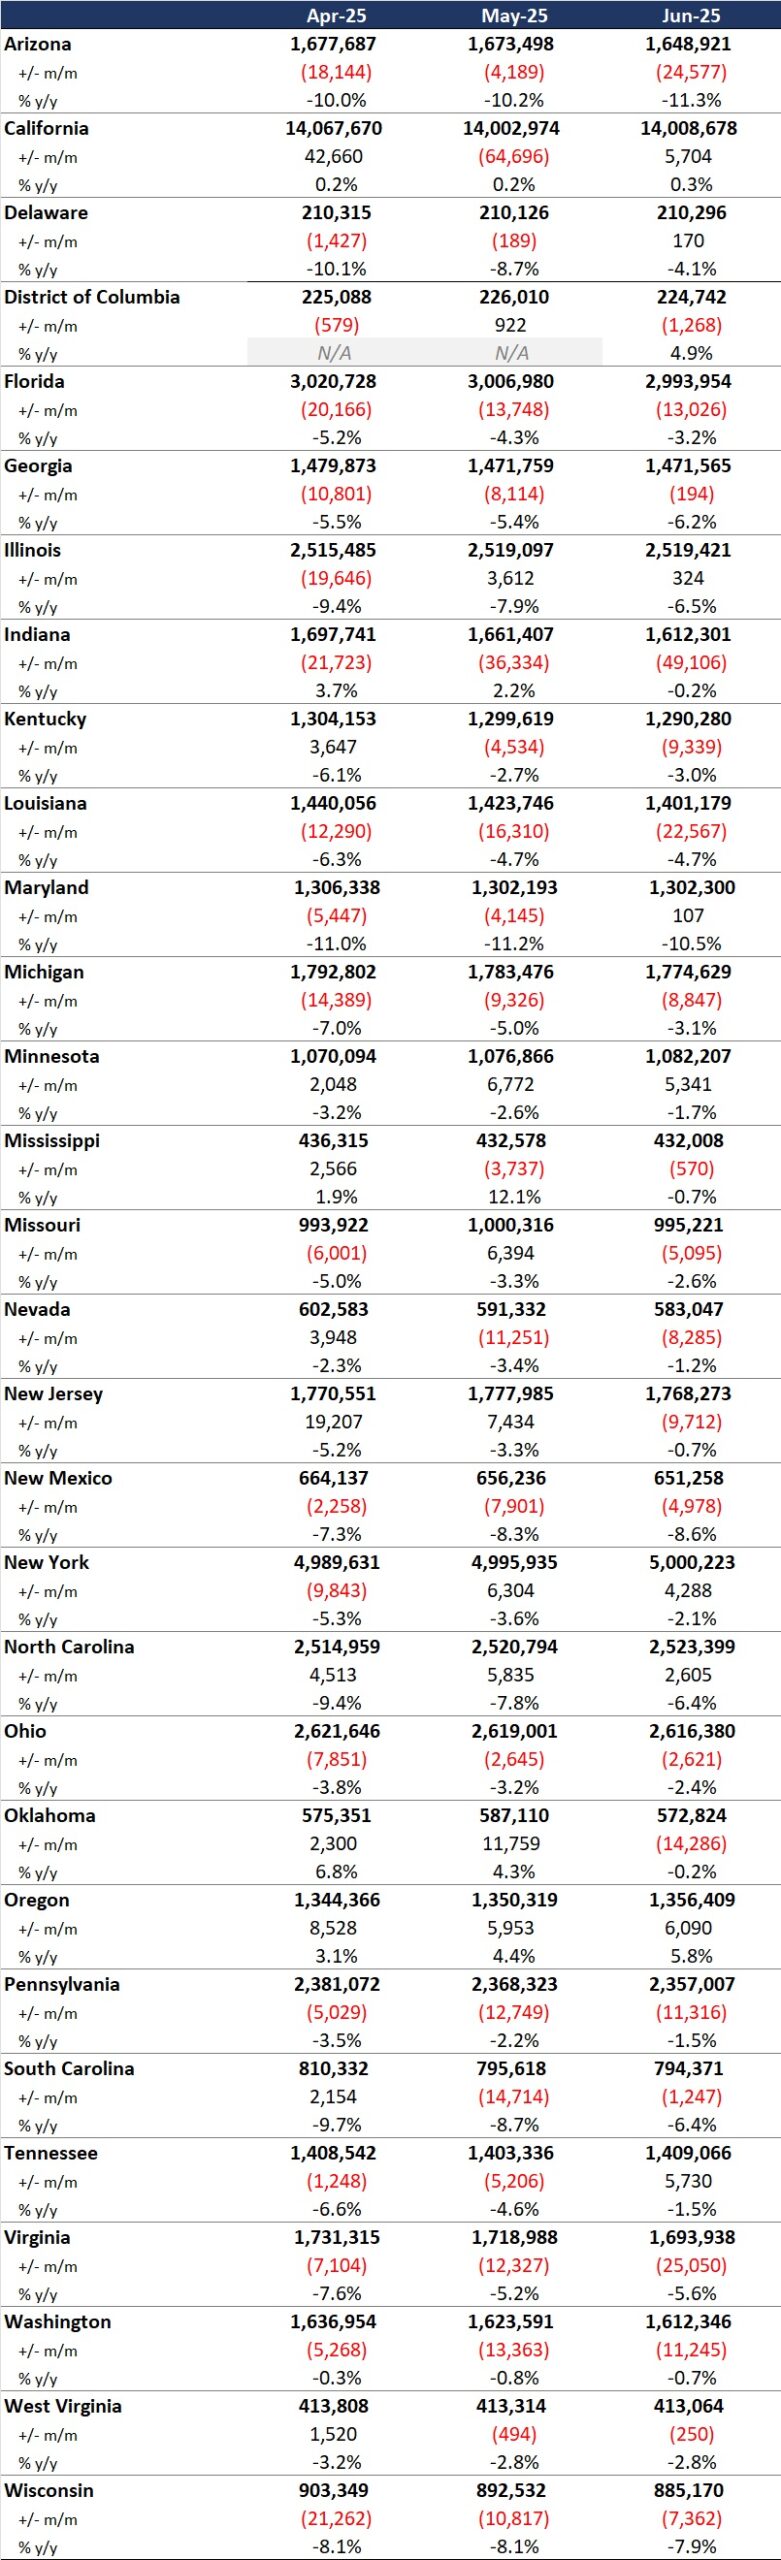
Year-over-year decline. As of June 2025, in the 30 states reviewed, Medicaid managed care enrollment declined by 1.6 million members year-over-year, a 2.7 percent drop from June 2024.
Widespread decreases. Of the 30 states, 27 experienced enrollment declines in June 2025 compared to June 2024. Oregon and the District of Columbia saw modest growth, while California remained flat (Table 1).
Sharpest contractions. Arizona and Maryland reported double-digit percentage drops in enrollment in June 2025 (Table 1), underscoring the uneven impact of redeterminations and eligibility policy changes.
Difference among expansion and non-expansion states. Among the 24 states included in the analysis that expanded Medicaid, enrollment fell by 1.2 million—a 2.5 percent drop—to 49.2 million. The six non-expansion states saw a steeper proportional decline of 4.2 percent, to a total of 8 million enrollees.
Table 1. 2Q25 Monthly MCO Enrollment by State, April–June 2025
Note: “+/- m/m” refers to the enrollment change from the previous month, and “% y/y” refers to the percentage change in enrollment from the same month in the previous year.
The data in Table 1 should be viewed as a sampling of enrollment trends across these states rather than as a comprehensive comparison, which cannot be established based solely on publicly available monthly enrollment data. It is also important to note the limitations of the data presented. For example, not all states report data at the same time during the month, resulting in a range of snapshots from the beginning to the end of the month. Second, in some instances, the data cover all Medicaid managed care programs, while in others they reflect only a subset of the broader managed Medicaid population, depending on what data is publicly available.
Market Share and Plan Dynamics
HMAIS’s report includes plan-level details for nearly 300 plans, covering corporate ownership, program participation, and tax status. As of June 2025, Centene continues to lead the national Medicaid managed care market with 17.8 percent share, followed by Elevance (10.4 percent), United (8.6 percent), and Molina (6.2 percent; see Table 2).
Table 2. National Medicaid Managed Care Market Share by Number of Beneficiaries for a Sample of Publicly Traded Plans, June 2025
What to Watch
The OBBBA (P.L. 119-21) calls for significant changes to Medicaid eligibility and enrollment policies, including work requirements and more frequent eligibility redeterminations. Projections indicate that Medicaid and Children’s Health Insurance Program enrollment could decline by up to 7.5 million people by 2034. In addition, the Centers for Medicare & Medicaid Services (CMS) has announced that it will not approve or extend waivers for multi-year continuous eligibility for adults or children.
As these policies are implemented, state governments and healthcare organizations should prepare for increased administrative complexity, potential coverage disruptions, and the resulting effect on MCO revenue and value-based care arrangements.
Connect with Us
HMA is home to experts who know the Medicaid managed care landscape at the federal and state levels. As the Medicaid landscape continues to evolve, HMAIS equips stakeholders with timely, actionable intelligence, including enrollment data, quarterly by-plan and by-state enrollment reports, financials, Medicaid demonstration and Rural Health Transformation program tracking, and a robust library of publicly available Medicaid-related documents. HMAIS combines publicly available information with HMA expert insights on the structure of Medicaid in each state, as well as our comprehensive, proprietary State Medicaid Overviews.
For questions about the HMAIS enrollment report and information about the HMAIS subscription, contact our experts below.
This week, our In Focus section highlights findings from Health Management Associates Information Services’ (HMAIS’s) review of 2024 statutory filings submitted to the National Association of Insurance Commissioners (NAIC). These filings provide a nationwide view of Medicaid managed care plan profitability and medical loss ratios (MLRs) across 221 plans operating in 39 states, the District of Columbia, and Puerto Rico.
These data build upon and offer additional context to a previous analysis conducted by HMA and Wakely, an HMA Company, of increasing post-pandemic financial pressures driven by acuity increases resulting from the continuous eligibility unwinding and increases in behavioral health and home and community-based services access and utilization.
Medicaid Managed Care Underwriting Gains and Losses
As state Medicaid programs have increasingly moved from fee-for-service to managed care, a foundational assumption has been that efficient managed care organizations (MCOs) reduce waste and deliver high quality, cost-effective healthcare services. This transition has made Medicaid plan performance and sustainability a central focus for policymakers and actuaries alike.
Medicaid capitation rates must be actuarially sound, which means they must be projected to cover all “reasonable, appropriate, and attainable costs,” including medical administrative costs, plus a margin for insurance risk, even for nonprofit plans. According to the Society of Actuaries 2024 research, average underwriting margins in Medicaid rates ranged from 0.35 percent to 3.15 percent, with a consistent average between 1.2 percent and 1.3 percent.
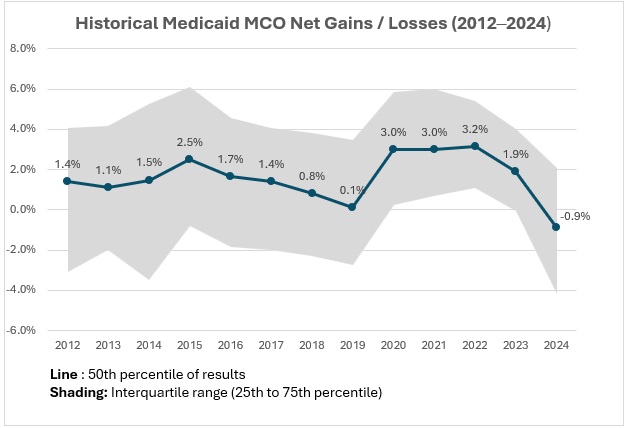
However, actual results often deviate from projections for reasons that may be challenging to predict. Rate setting is an inherently forward-looking process, and even with conservative assumptions, unexpected shifts in enrollment, acuity, or service utilization can lead to significant deviations from projected results. Retrospective reviews show variability in margins over time (see Figure 1).
Based on HMAIS’s analysis, Medicaid MCOs sustained modest but steady gains from 2012 through 2017. After a decline between 2016 and 2019, margins rebounded to approximately 3 percent until 2022, narrowed in 2023 to 1.9 percent, and turned negative in 2024 at -0.9 percent.
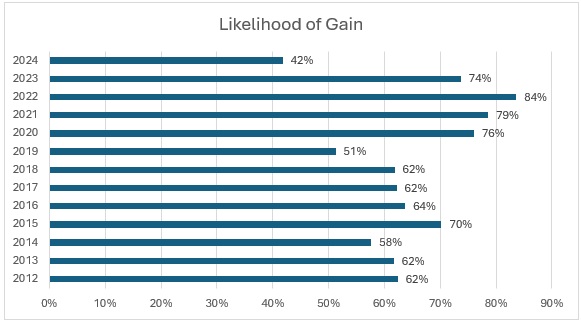
For the first time in over a decade, more plans experienced losses than gains in 2024 (see Figure 2), with only 42 percent reporting positive margins, down from the decade high of 84 percent in 2022. This shift raises critical questions about sustainability and participation in Medicaid managed care.
Figure 2. Medicaid Managed Plans Likelihood of Gain, 2012‒2024 (39 States, DC)
The “Likelihood of Gain” chart tracks the percentage of Medicaid managed care plans reporting an underwriting gain each year from 2012 to 2024. For most years, the likelihood that a plan posted a gain was relatively high, typically between 60 percent and 80 percent. The probability reached a recent peak in 2022, with 84 percent of plans reporting gains, and remained elevated in 2023 (74 percent). In 2024, however, the likelihood of gain dropped sharply to just 42 percent, the lowest level in the 12-year period.
Risk Corridors, Medical Loss Ratios, and Structural Policy Shifts
MLRs show the portion of plan revenue spent on medical care as compared with the costs to operate the plan and the underwriting gain or loss described previously. When MLRs rise or fall, it can be an indication that medical cost trends experienced by health plans differ from the assumptions used by state rate setting actuaries. High MLRs are the key driver of underwriting gains, and low MLRs are associated with higher profitability. All states report MLRs to the Centers for Medicare & Medicaid Services (CMS), and some enforce minimum MLRs with a remittance provision, requiring plans to return funds if their MLR goes below a certain level.
Risk corridors are another tool that states use to manage financial volatility. These mechanisms share gains or losses between plans and states when results deviate significantly from pricing assumptions, offering protection to MCOs and the state alike, in contrast to minimum MLR provisions with a remittance provision, which only protects the state. During the COVID-19 pandemic, many states implemented or expanded risk corridors to recoup overpayments because of lower utilization. Some risk corridors were set retroactively—a practice CMS now prohibits.
In 2024, MLRs reached a decade high of 90.8 percent, as indicated by HMAIS’s analysis. Driving this increase were heightened utilization rates, increased enrollee acuity, and the end of continuous Medicaid coverage protections in 2023. As healthier, lower-cost members left Medicaid, plans were left serving a more complex population with higher per-member costs. Inflation in medical costs—especially for behavioral health and home and community-based services—added more pressure. Delayed or avoided care during the COVID-19 pandemic may also have played a role, as members sought more services in 2022‒2024, resulting in a surge in utilization greater than what was priced into rates.
Many states put risk corridors in place to stabilize margins from 2020 to 2022, which may have contributed to the tight band of outcomes around the high underwriting gains in that period. However, many states have been removing them for 2024, 2025, and 2026. Without these protections, plans may face greater exposure to underpayment in 2025 and 2026 if cost trends continue to outpace rate assumptions.
What to Watch
Rate setting conversations between states and plans for 2026 are happening now, and in many cases they are quite challenging. In addition to meeting actuarial soundness requirements, states also must balance their budgets, and some may be facing limitations on their traditionally used tools.
Looking ahead, it will be increasingly important that states and plans partner to find cost savings that can ensure the program’s long-term sustainability.
A subscription to HMAIS provides access to comprehensive financial intelligence on Medicaid managed care. Far beyond surface-level snapshots, HMAIS delivers health plan-level financial performance metrics, enrollment trends, and state policy developments that directly shape rate setting and operational strategy. Whether you’re a state official, health plan executive, or policy strategist, HMAIS provides the financial clarity and policy context needed to anticipate regulatory shifts, benchmark performance, and make confident, data-driven decisions.
For questions about the analysis discussed in this article, contact our experts below.
As states and stakeholders seek greater transparency and accountability in Medicaid, a new analysis from Health Management Associates (HMA), offers a fresh perspective on how dollars flow through the system. Drawing on publicly available data from the Transformed Medicaid Statistical Information System (T-MSIS), HMA disaggregated funding dispersed to Medicaid managed care organizations to discern spending for specific categorically eligible populations. The findings significantly enhance policy discussions and can facilitate development of pragmatic and specific care management interventions that support quality patient care.
For policymakers, regulators, and other stakeholders, this level of disaggregation provides a clearer view of how public dollars are used—and where there may be opportunities to improve performance or reinvest savings. It also supports more informed rate development and contract negotiations, particularly as states pursue value-based purchasing and other reforms. As Medicaid continues to evolve, especially in the context of budget pressures and changes in enrollment and risk profiles of enrollees, understanding the financial picture of managed care programs is essential to ensuring sustainability.
HMA’s team of experts—including actuaries, former Medicaid directors, and data analysts—has deep experience working with T-MSIS data and advising states, plans, and providers on Medicaid program analysis, evaluation, and strategy. For more information about working with T-MSIS data and the insights it can provide, contact our experts below.
In this week’s In Focus section, Health Management Associates Information Services (HMAIS) draws on its database of monthly enrollment in Medicaid managed care programs to provide the latest quarterly analysis of Medicaid managed care enrollment, offering a snapshot of developments across 28 states.[1] The data and insights are particularly timely as stakeholders, including states, Medicaid managed care organizations (MCOs), hospitals and health systems, and providers, continue to plan for multiple possible federal policy changes and the operational realities that will follow.
HMAIS also compiles a more detailed quarterly Medicaid managed care enrollment report representing nearly 300 health plans in 41 states. The report provides by plan enrollment plus corporate ownership, program inclusion, and for-profit versus not-for-profit status, with breakout tabs for publicly traded plans. Table 1 shows a sampling of plans and their national market share of Medicaid managed care beneficiaries based on a total of 66 million enrollees. These data should be viewed as a broader representation of enrollment trends rather than as a comprehensive comparison.
Key Insights from Q1 2025 Data
The 28 states included in our review have released monthly Medicaid managed care enrollment data via a public website or in response to a public records request from Health Management Associates (HMA). This report reflects the most recent data posted or obtained. HMA has made the following observations related to the enrollment data:
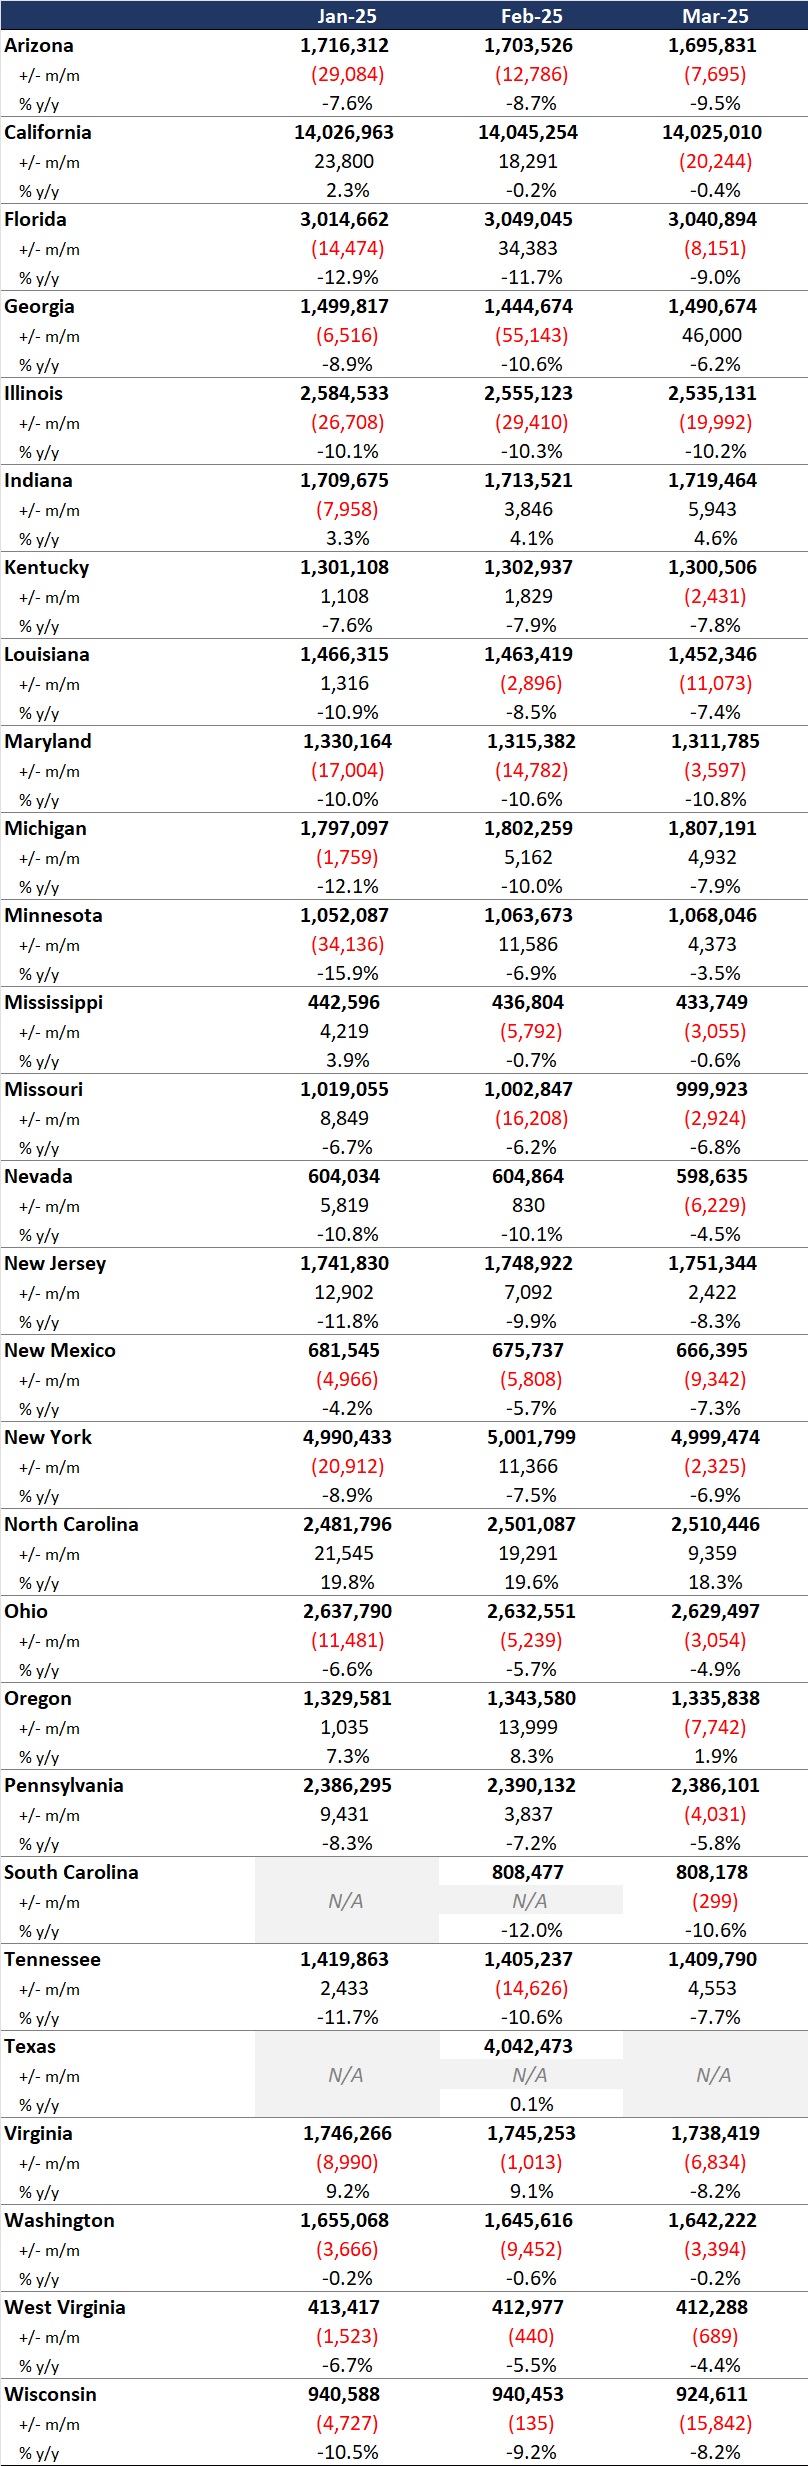
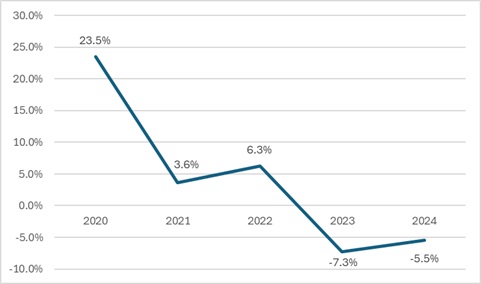
Year-over-year growth. As of March 2025, across the 28 states reviewed, Medicaid managed care enrollment declined by 2.5 million members year-over-year, a 3.9 percent drop as of March 2025 (see Figure 1). This marks a continuation of the downward trend reported in late 2024, though with notable variation across states.
Figure 1. Year-over-Year Growth in Medicaid Managed Care States, 2020−24, March 2025
Localized growth amid broader declines. While most states experienced enrollment reductions, Indiana and North Carolina bucked the trend with measurable gains, suggesting the influence of state-specific policy shifts or demographic factors. Oregon and Texas also saw modest growth.
Sharpest contractions. Illinois, Maryland, and South Carolina, reported double-digit percentage drops, underscoring the uneven impact of redeterminations and eligibility changes.
Difference among expansion and non-expansion states. Among the 21 states included in our analysis that expanded Medicaid, enrollment fell by 1.8 million (-3.6%) to 48.6 million. In contrast, the seven non-expansion states saw a steeper proportional decline (-5.4%), to a total of 12.2 million enrollees.
Table 1. Monthly MCO Enrollment by State, January 2025 through March 2025
Note: In Table 1 above and the state tables that follow, “+/- m/m” refers to the enrollment change from the previous month, and “% y/y” refers to the percentage change in enrollment from the same month in the previous year.
It is important to note the limitations of the data presented. First, states report the data at the varying times during the month. Some of these figures reflect beginning of the month totals, whereas others reflect an end of the month snapshot. Second, in some instances, the data are comprehensive in that they cover all state-sponsored health programs that offer managed care options; in other cases, the data reflect only a subset of the broader managed Medicaid population. This limitation complicates comparison of the data described above with figures reported by publicly traded Medicaid MCOs. Hence, the data in Table 1 should be viewed as a sampling of enrollment trends across these states rather than a comprehensive comparison, which cannot be established solely based on publicly available monthly enrollment data.
Market Share and Plan Dynamics
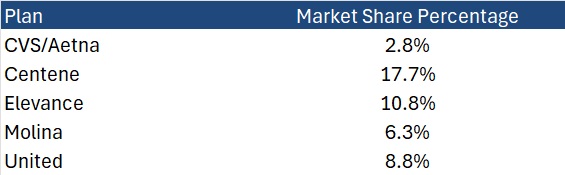
Using our data repository from 300 health plans across 41 states, HMAIS’s report addresses corporate ownership, program participation, and tax status. As of March 2025, Centene continues to lead with 17.7 percent of the national Medicaid managed care market, followed by Elevance (10.8%), United (8.8%), and Molina (6.3%), as Table 2 shows.
Table 2. National Medicaid Managed Care Market Share by Number of Beneficiaries for a Sample of Publicly Traded Plans, March 2025
What to Watch
The policy backdrop remains fluid. The US House of Representatives’ passage of the One Big Beautiful Bill Act introduces sweeping changes to Medicaid financing, including proposed cuts of up to $715 billion. Additional federal proposals, such as mandatory work requirements, could further reshape enrollment patterns.
Stakeholders should prepare for:
Implementation of work/community engagement mandates for certain adult populations
Potential redesign of Affordable Care Act expansion programs
Retraction of federal regulations focused on streamlining of eligibility and redetermination processes to improve accuracy and efficiency
Connect with Us
HMA is home to experts who know the Medicaid managed care landscape at the federal and state levels. As the Medicaid landscape continues to evolve, HMAIS equips stakeholders with timely, actionable intelligence. Our subscription service includes enrollment data, financials, waiver tracking, and a robust library of public documents.
For more information about the HMAIS subscription, contact our experts below.
[1] Arizona, California, Florida, Georgia, Illinois, Indiana, Kentucky, Louisiana, Maryland, Michigan, Minnesota, Mississippi, Missouri, Nevada, New Jersey, New Mexico, New York, North Carolina, Ohio, Oregon, Pennsylvania, South Carolina, Tennessee, Texas, Virginia, Washington, West Virginia, Wisconsin.
Our second In Focus section reviews the most recent Medicaid enrollment trends in capitated risk-based managed care programs in 29 states.[1] Health Management Associates Information Services (HMAIS) collected and analyzed monthly Medicaid enrollment data from the fourth quarter (Q4) of 2024.
The data offer a timely overview of trends in Medicaid managed care enrollment and valuable insights into state-level and managed care organization (MCO)-specific enrollment patterns. This information allows state governments, their partners, and other organizations interested in Medicaid to track enrollment shifts. Understanding the underlying drivers of enrollment shifts is critical for shaping future Medicaid policies and adjusting program strategies amid a dynamic healthcare landscape.
Overview of the Data
The 29 states included in our review have released monthly Medicaid managed care enrollment data via a public website or in response to a public records request from Health Management Associates (HMA). This report reflects the most recent data posted or obtained. HMA has made the following observations related to the enrollment data (see Table 1):
As of December 2024, across the 29 states tracked in this report, Medicaid managed care enrollment was 61.7 million, down by 3.6 million (-5.5%) year-over-year.
Though most states experienced declines in enrollment, six states saw enrollment increases as of December 2024—double the number of states from the previous year.
Figure 1. Year-Over-Year Medicaid Managed Care Enrollment Percent Change in Select States, 2020−24
Among the 22 expansion states included in this report, net Medicaid managed care enrollment has decreased by 2.1 million (-4%) to 49.5 million members at the end of Q4 2024, compared with the same period in 2023.[2]
Among the seven states included in this report that had not expanded Medicaid as of December 2024, net Medicaid managed care enrollment decreased by 1.5 million, or 1 percent, to 12.3 million members at the end of Q4 2024 compared with to the same period in 2023.
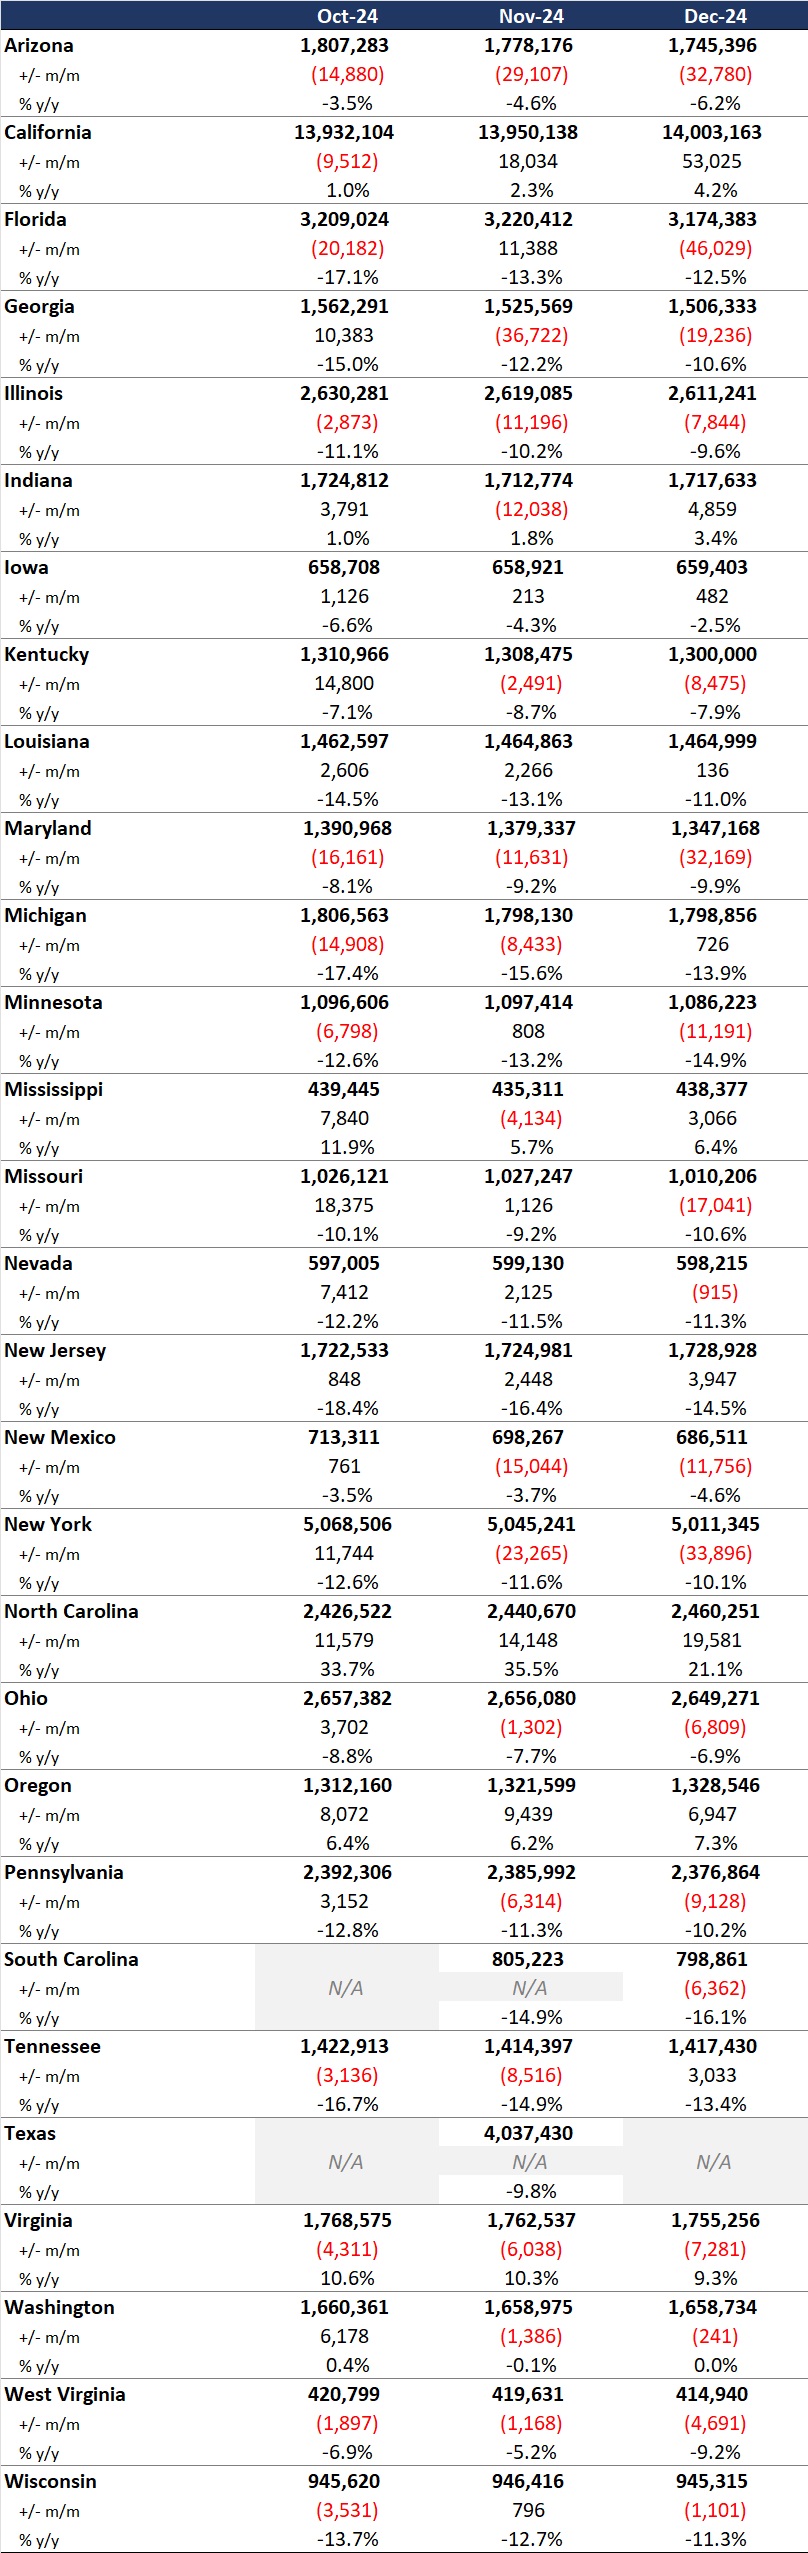
Table 1. Monthly MCO Enrollment by State—October through December 2024
Note: In Table 1 above, “+/- m/m” refers to the enrollment change from the previous month. “% y/y” refers to the percentage change in enrollment from the same month in the previous year.
It is important to note the limitations of the data presented. First, not all states report the data at the same time during the month. Some of these figures reflect beginning of the month totals, whereas others reflect an end of the month snapshot. Second, in some cases the data are comprehensive in that they cover all state-sponsored health programs that offer managed care options; in other cases, the data reflect only a subset of the broader managed Medicaid population. This limitation complicates comparison of the data described above with figures reported by publicly traded Medicaid MCOs. Hence, the data in Table 1 should be viewed as a sampling of enrollment trends across these states rather than as a comprehensive comparison, which cannot be established based solely on publicly available monthly enrollment data.
HMAIS also compiles a more detailed quarterly Medicaid managed care enrollment report representing nearly 300 health plans in 41 states. The report provides by plan enrollment plus corporate ownership, program inclusion, and for-profit vs. not-for-profit status, with breakout tabs for publicly traded plans. Table 2 shows a sampling of plans and their national market share of Medicaid managed care beneficiaries based on a total of 66.3 million enrollees. These data too should be viewed as a broader representation of enrollment trends rather than as a comprehensive comparison.
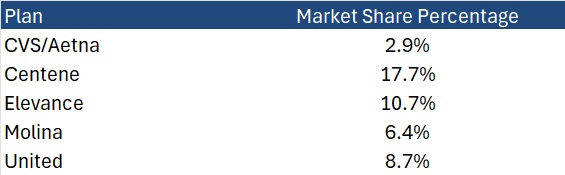
Table 2. National Medicaid Managed Care Market Share by Number of Beneficiaries for Sample of Publicly Traded Plans, 2024
What to Watch
Enrollment in Medicaid MCOs has experienced significant fluctuations recently, influenced both by policy changes and economic factors. Since April 2023, Medicaid enrollment has been on a downward trajectory as states complete eligibility redeterminations after the end of the COVID-19 public health emergency. This trend, coupled with financial and political challenges, necessitates strategic planning for stakeholders to navigate the evolving Medicaid landscape effectively.
Potential changes that may affect enrollment and require scenario and readiness planning include:
Federal requirement, or a new state option, to implement Medicaid work requirements for at least some categories of enrollees
Changes to the federal financial match policy, which may cause some states to make different decisions about their Affordable Care Act expansion program for adults
Modifications in requirements and expectations for more efficient eligibility processes to improve the accuracy of determinations and assignment to eligibility categories
Connect with Us
HMA is home to experts who know the Medicaid managed care landscape at the federal and state levels. The HMAIS subscription provides point-in-time and longitudinal Medicaid enrollment data, health plan financials, and additional actionable information about eligibility expansions, demonstration and waiver initiatives, as well as population- and service-specific information. HMAIS also includes a comprehensive public documents library containing Medicaid requests for proposals and responses, model contracts, scoring sheets, and protests.
For detail about the HMAIS enrollment report and subscription service, contact our experts below.
[1] Arizona, California, Florida, Georgia, Illinois, Indiana, Iowa, Kentucky, Louisiana, Maryland, Michigan, Minnesota, Mississippi, Missouri, Nevada, New Jersey, New Mexico, New York, North Carolina, Ohio, Oregon, Pennsylvania, South Carolina, Tennessee, Texas, Virginia, Washington, West Virginia, Wisconsin.
Notably, because of the timing of the draft notices and proposed rule, Trump Administration officials ultimately had more input into policies omitted from the rate notice and final policy rule than on policies that were finalized. For example, the final rule is exclusive of proposals to expand coverage for anti-obesity medications, guardrails for artificial intelligence (AI), and new requirements related to utilization management and prior authorization procedures.
In his confirmation hearing, CMS Administrator Mehmet Oz, MD, cited Medicare Advantage prior authorization practices and health risk assessments that lead to upcoding as areas that deserve further consideration and scrutiny, raising the potential for future regulatory shifts and even legislative reform. With the possibility of Medicare, including MA, facing cuts as part of broader budget negotiations in Congress, the rate notice and policy rule offer program stability counterbalancing the political and fiscal pressures that may emerge this year.
CMS has sought to stabilize MA and Part D programs into 2026, and stakeholders can benefit from understanding the impact in markets for 2026 and the signals of potential regulatory changes to come. For more in-depth analysis and insights on the rate notice, look for our policy and actuarial experts’ brief due out next week.
The remainder of this In Focus article reviews CMS’s decisions on major payment and policy proposals in the Rate Announcement and Final Rule and examines key considerations for healthcare stakeholders.
Payment Impact on Medicare Advantage Organizations
In the CY 2026 Rate Announcement, CMS projects that federal payments to MA plans will increase by 5.06 percent from 2025 to 2026, which represents a $25 billion increase in expected payments to MA plans next year. According to CMS, this represents an increase of 2.83 percentage points compared with the CY 2026 Advance Notice that is largely attributable to an increase in the effective growth rate. The increase in the effective growth rate—increasing to 9.04 percent in the Rate Announcement from 5.93 percent in the Advance Notice—is primarily the result of the inclusion of additional data on Medicare fee-for-service (FFS) expenditures, including payment data through the fourth quarter of 2024.
The Rate Announcement estimates represent the average increase in payments to MA plans and actual payments will vary from plan to plan. Below, Table 1 provides CMS estimates of the impact of finalized payment changes on net MA plan payments.
MA Risk Adjustment Changes
As expected, CMS finalized the last year of the three-year phase-in of the MA risk adjustment model, which requires calculating 100 percent of the risk scores using only the 2024 CMS-HCC (Hierarchical Condition Category) model in 2026. CMS also addressed stakeholder concerns with the planned transition toward a risk adjustment model based on MA encounter data, as previewed in the CMS CY 2026 Advance Notice. CMS pledged to engage stakeholders in this model development process while continuing to evaluate the feasibility, transparency, and timing of a future transition to an encounter-based risk adjustment model.
CMS also finalized the MA coding pattern adjustment factor of 5.9 percent for CY 2026, which is the statutory minimum adjustment factor to account for differences in coding patterns between MA plans and providers under Medicare FFS Parts A and B.
Part D Risk Adjustment
For CY 2026, CMS finalized the revised 2026 RxHCC model with adjustments for maximum fair price drugs. Importantly, CMS also finalized using separate FFS normalization factors for MA-Prescription Drug (MA-PD) plans and Prescription Drug Plans (PDPs), making 2026 the second year CMS will vary normalization for these two markets. The calculation of the factors for CY 2026 is different, however, and will have substantially greater impact than the method used previously. It also will reduce Part D risk scores significantly for MA-PD plans while increasing scores for PDPs.
MA Star Ratings
CMS continues to solicit feedback from stakeholders on ways to simplify and refocus MA Star Ratings measures to focus more on clinical care, outcomes, and patient experience of care measures. Also included in the CY 2026 Rate Announcement are non-substantive measure specification updates and a list of measures included in the Part C and Part D improvement measures and categorical adjustment index for the 2026 Star Ratings.
Separately, in the policy and technical changes rule, CMS finalized new regulatory requirements designed to enhance MA beneficiary protections in an inpatient setting, provisions related to allowable special supplemental benefits for the chronically ill (SSBCI), and the care experience for dually eligible beneficiaries enrolled in MA special needs plans.
Enhancing MA Beneficiary Appeal Rights and Notification Requirements
CMS is finalizing provisions that limit the ability of MA plans to reopen and modify a previously approved inpatient hospital decision on the basis of information gathered after the approval. Under the final rule, MA plans will be able to reopen an approved hospital admission only due to error or fraud. In addition, CMS finalized several provisions to enhance beneficiary appeal rights and new reporting and notice requirements, including:
Ensuring that MA appeals rules apply to adverse plan decisions, regardless of whether the decision was made before, during, or after the receipt of such services
Codifying existing guidance that requires plans to give a provider notice of a coverage decision
Ensuring enrollees have a right to appeal MA plan coverage denials that affect their ongoing source of treatment
Non-Allowable Special Supplemental Benefits for the Chronically Ill
The final rule establishes guardrails for SSBCI benefits by codifying a list of non-allowable examples (e.g., unhealthy food, alcohol, tobacco, life insurance). CMS did not finalize proposals that were designed to improve administration of supplemental benefits and enhance transparency of the availability of such benefits.
Improving Care Experience for Dual Eligibles
CMS finalized new requirements for dual eligible special needs plans (D-SNPS) that are applicable integrated plans (AIPs) as follows:
D-SNPs will be required to have integrated member ID cards for their Medicare and Medicaid plans
D-SNPs will be required to conduct an integrated health risk assessment for Medicare and Medicaid, rather than separate ones for each program.
These provisions affecting certain D-SNPS plans will be effective for the 2027 plan year.
Provisions Pertaining to the Medicare Part D Inflation Reduction Act
CMS is finalizing proposals to codify existing requirements related to key provisions of the Inflation Reduction Act, including no cost sharing for adult vaccines and capping monthly copayments for insulin at $35. In addition, CMS is codifying existing guidance related to the implementation of the Medicare Prescription Payment Plan, which is also part of the Inflation Reduction Act.
Key Proposals CMS Has Yet to Finalize
As noted earlier, CMS finalized a streamlined rule that excluded several regulatory changes identified in the November 2024 proposed rule. In addition to provisions related to coverage of anti-obesity medications, guardrails for AI, and mandatory analysis of the health equity impact of MA plans utilization management practices, the following proposals were not finalized. CMS notes that these proposals might be finalized in future rulemaking.
Expanding Medicare Part D Medication Therapy Management (MTM) eligibility criteria
Ensuring equitable access to behavioral health services by applying MA cost-sharing limits
Enhancing the Medicare Plan Finder to include information on plan provider directories
Promoting informed choice by enhancing CMS review of MA marketing and communication materials
Enhancing rules on MA plans’ use of internal coverage criteria
Key Considerations
The policies finalized in the CY 2026 Rate Announcement are projected to increase average Part C payments to MA plans by 5.06 percent in CY 2026—a significant uptick from the payment updates originally proposed in the CY 2026 Advance Notice. Nonetheless, the final rate increase will have varying effects across MA plans, with some experiencing larger or smaller impacts in CY 2026. MA plans should assess these outcomes as they prepare their bid submissions for 2026.
According to the CY 2026 Rate Announcement, CMS expects that the 5.06 percent increase will provide continued stability for the MA program and its beneficiaries while ensuring accurate and appropriate payments to Medicare Advantage organizations.
In the CY 2026 MA and Part D Final Rule, CMS adopted a significantly scaled-back final rule, which omitted some of the more far-reaching proposals for MA and Part D that were originally proposed in November 2024. CMS, however, could potentially revisit and finalize some of these proposals in future rulemaking. Moreover, new regulatory requirements that enhance enrollee protections in inpatient care settings and improving the care experience for dual eligibles signal CMS’s continued interest in improving program oversight and enhancing consumer protections for MA beneficiaries.
Connect With Us
MA stakeholders need to undertake scenario planning and be prepared to adapt to a rapidly evolving federal policy environment. From modeling and impact assessments of specific policy changes to strategy development and implementation, HMA is home to experts with diverse skill sets. Our team can help stakeholders assess and prepare for potential changes to prior authorization, looking holistically at their organization’s operations, patient care models, and reimbursement strategies. Our team also provides detailed modeling and assessments to ensure health plans are prepared for changes in risk adjustment and coding policies, supplemental benefits, and other key issues affecting capitation payment, bids, and care delivery models.
For details about the finalized payment and policy rules contact our featured experts below.