This In Focus section reviews the request for applications (RFA) that the Commonwealth of Pennsylvania Department of Human Services (DHS) released January 30, for the Community HealthChoices (CHC) Program. CHC is the mandatory managed long-term services and supports (MLTSS) program, which serves five CHC zones that cover all 67 counties in the commonwealth.
Notably, this procurement, as compared to the original CHC procurement in 2018, has increased emphasis on innovative approaches to address health equity and the Social Determinates of Health (SDOH). The health equity focus goes beyond traditional health-related social needs such as access to housing, transportation, food, and employment, and addresses some SDOHs that have a particular impact on the CHC population, such as environmental conditions and addressing hazardous or unsafe living conditions.
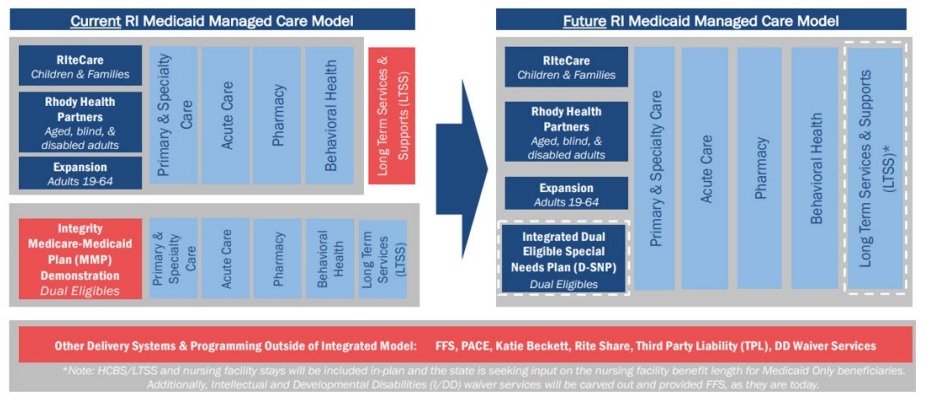
Behavioral health remains carved-out to separate behavioral health managed care organizations (BH-MCOs). Instead, CHC applicants will need to articulate how they will coordinate with the BH-MCOs to ensure access to appropriate BH services, which continues to be an area of significant interest for state Medicaid officials.
Background
The CHC Program serves individuals who are dually eligible for Medicare and Medicaid and people with physical disabilities who receive home and community-based waiver services or nursing facility care.
Participants may receive LTSS in the community or in a nursing facility.
CHC is the sole program option for fully dual eligible beneficiaries and most nursing facility clinically eligible (NFCE) individuals who reside in the five zones. The regional CHC zones are as follows:
- Southwest zone: Allegheny, Armstrong, Beaver, Bedford, Blair, Butler, Cambria, Fayette, Green, Indiana, Lawrence, Somerset, Washington, and Westmoreland counties.
- Southeast zone: Bucks, Chester, Delaware, Montgomery, and Philadelphia Counties.
- Remaining zones and respective counties, including
- Lehigh/Capital zone: Adams, Berks, Cumberland, Dauphin, Fulton, Franklin, Huntingdon, Lancaster, Lebanon, Lehigh, Northampton, Perry, York
- Northeast zone: Bradford, Carbon, Centre, Clinton, Columbia, Juniata, Lackawanna, Luzerne, Lycoming, Mifflin, Monroe, Montour, Northumberland, Pike, Schuylkill, Snyder, Sullivan, Susquehanna, Tioga, Union, Wayne, Wyoming.
- Northwest zone: Cameron, Clarion, Clearfield, Crawford, Elk, Erie, Forest, Jefferson, McKean, Mercer, Potter, Venango, Warren
RFA
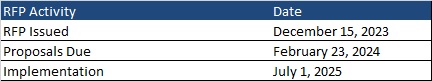
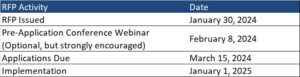
Medicaid managed care organizations (MCOs) may submit applications for one or more zones. Applications are due March 15, 2024. The department anticipates awarding agreements to three to five CHC-MCOs in each of the five CHC zones. Selected applicants must provide CHC services in all counties in the zone(s) for which they are selected to participate and improve the accessibility, continuity, and quality of services for participants in the CHC program. The contract will run for five years and will have three one-year renewal options.
DHS indicates that the awarded CHC-MCOs must have an aligned dual-eligible special needs plan (D-SNP) and a current Medicare Improvement for Patients and Providers Act (MIPPA) agreement with the department. The aligned D-SNP must be operational and the MIPPA agreement must be in place by the anticipated implementation date (January 1, 2025).
DHS indicates selected MCOs must be as flexible and adaptable as possible and demonstrate the ability to coordinate services for multiple populations and across multiple programs, including programs with a focus that is broader than the delivery of healthcare services and LTSS.
Other RFA highlights include the following:
- Does not require a cost submittal.
- Includes small diverse business (SDB) or veteran business enterprise (VBE) goals of 11 percent and 3 percent respectively. Applicants must include separate SDB and VBE submittals for each zone in its application.
- Includes a contractor partnership program (CPP) which requires entities that are awarded a contract or agreement with DHS to establish a hiring target to support Temporary Assistance for Needy Families (TANF) beneficiaries in obtaining employment with the contractor, grantee, or their subcontractors.
Notably, DHS has provided itself flexibility within the RFA to implement a pay-for-performance incentive to MCOs. Under this policy, DHS could make incentives available to MCOs that help participants successfully complete the financial eligibility redetermination process with their local County Assistance Offices (CAOs). The department may implement additional pay-for-performance incentives in later years.
Timeline
Evaluation
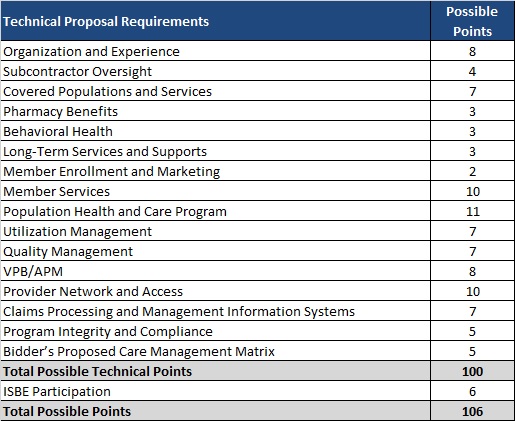
For an applicant to be considered responsible for this RFA and eligible for selection of best and final offers (BAFOs) and negotiations:
- The total score for the technical submittal of the application must be greater than or equal to 75 percent of the available raw technical points
- The applicant’s financial information must demonstrate that the organization possesses the financial capacity to fulfill the good faith performance of the agreement
The evaluation committee will evaluate technical submittals for each zone separately. For each zone, DHS must select for negotiations the applicants with the highest overall score. The weight for the technical criterion is 100 percent of the total available points. Technical evaluation will be based on soundness of approach, applicant qualifications, personnel qualifications, and understanding the project.
The final technical scores will be determined by giving the maximum number of technical points available to the application with the highest raw technical score. The remaining applications will be rated by applying the formula located at RFP Scoring Formula.
Financial information will not be scored as part of the technical submittal. It will be reviewed only to determine an applicant’s financial responsibility.
SDB and VBE participation submittals will not be scored, however, if an applicant fails to satisfy the SDB or VBE requirements described, and DHS will reject the application.
DHS will not score the CPP submittal. Once an applicant has been selected for negotiations, DHS will review the CPP submittal.
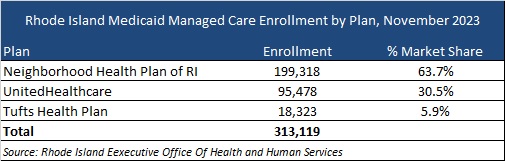
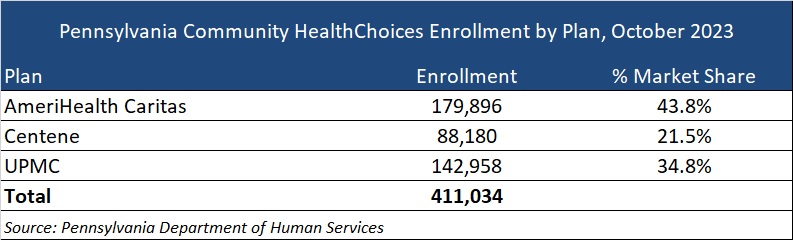
Current Market
The CHC incumbents are AmeriHealth Caritas, Centene, and University of Pittsburgh Medical Center (UPMC), serving 411,034 CHC members as of October 2023.
DHS has published a historical data summary for the CHC program along with other DHS reports at: Community HealthChoices Historical Data.
Link to solicitation: All files on PA eMarketplace
Want to know more about how the next phase of Community Health Choices will impact your organization?
HMA’s Pennsylvania-based teams can assist organizations seeking to understand the implications of this important procurement, key program changes and what the outcome may mean for providers, community base organizations, and other stakeholders. Please contact Dianne Bisacky with questions or if you are seeking more detailed analysis of this procurement or the Community Health Choices program generally.
Nine States to Participate in Children’s Behavioral Health Policy Lab
LANSING, MICH. – Health Management Associates (HMA), in partnership with the Annie E. Casey Foundation, Casey Family Programs, National Association of State Mental Health Program Directors (NASMHPD), the Child Welfare League of America (CWLA), the American Public Human Services Association (APHSA), National Association of Medicaid Directors (NAMD) and the Centene Foundation, will convene a Children’s Behavioral Health (CBH) State Policy Lab, Feb. 7-9 in Baltimore. HMA today announced that Georgia, Kansas, Kentucky, Maryland, Missouri, Pennsylvania, Texas, Utah, and Wisconsin will participate in the policy lab. MITRE, which previously hosted a related federal convening, will also take part in this state convening.
This pioneering effort, made possible by the partner organizations, aims to convene state interagency teams – including child welfare, juvenile justice, behavioral health, Medicaid, and K-12 public education – to collectively strategize, learn from innovators in the sector and promote cross-system alignment to drive outcomes for children, youth, and families.
COVID-19 has exacerbated long-standing system collaboration challenges across state child welfare, behavioral health, and Medicaid that lead to unsatisfactory outcomes for the most vulnerable children in our communities. Most worrisome is the worsening of behavioral and physical health challenges and trauma because of uncoordinated or fragmented care. This lack of coordinated strategy and policy leads to higher costs of treatment and also increasingly exposes states and local jurisdictions to threats or filings of class action lawsuits, and related settlements or those arising from Department of Justice investigations. Fortunately, federal and state efforts and investments to address the youth systems of care – including schools, community, delivery systems, and community-based child placing agencies – are in motion.
In November, a call for applications was released to U.S. states and territories for potential participation in the State Policy Lab. Applicants were required to identify demonstrated need, existing state agency governance structures focused on children and youth, technical assistance needs, and outcomes for attending the policy lab. The applications required demonstrated participation from Medicaid, child welfare and behavioral health agencies; a commitment to creating sustainable interagency solutions for children, youth, and their families and had to certify formal support from the Governor/Cabinet level.
An external independent panel reviewed applications for state agency participation using a standardized rubric that covered four domains:
- Gaps and opportunities analysis
- Intent of collaborative partnerships
- Approach to engagement of youth and adults with lived experience
- Imminent risks to public agency operations as a result of poor outcomes for children, youth, and their families
This convening is aimed at assisting child welfare, juvenile justice, behavioral health, Medicaid, and K-12 public education where possible to build upon existing efforts to improve outcomes for children, youth, and families, strategically layering on missing components and promoting alignment between them and with other agency priorities. Examples of what could be co-designed with state partners:
- Build a shared strategic vision for a comprehensive continuum of care that ensures access to the “right service, at the right time based on individual and family need.” This vision can strengthen prevention initiatives and ensure the full array of evidence-based community-based interventions including use of crisis response and stabilization models.
- Develop policies and strategies for improving the engagement of children, youth, and families with lived experiences to the “right part of the system for the right level of care,” agnostic of the door through which they enter any coordinated child serving system, while ensuring that all aspects of this system are anchored in equity.
Following the event, learnings and findings will be disseminated to help states and counties adopt innovative solutions to improve outcomes for children, youth, and their families.
For more information email: [email protected]