This week’s In Focus section delves into the Next Generation MyCare Ohio managed care program, spotlighting the request for applications (RFA) that the Ohio Department of Medicaid (ODM) released on May 31, 2024. The MyCare Ohio Program, which serves people who are dually eligible for both Medicaid and Medicare, is undergoing a substantial transformation. Transitioning from the financial alignment initiative (FAI) demonstration model used in 29 counties, it is evolving into a statewide, fully integrated dual eligible special needs plan (FIDE-SNP) model. This shift is more than procedural; it signifies a pivotal moment of transition to new federal D-SNP requirements.
Background
The MyCare Ohio Program launched in May 2014 as a Centers for Medicare & Medicaid Services (CMS) FAI demonstration. MyCare Ohio integrates Medicare and Medicaid benefits for dually eligible members enrolled in competitively selected MyCare Ohio managed care plans, providing one care coordinator and streamlined communication and services. It serves 150,000 individuals in 29 counties.
CMS is sunsetting all FAI demonstration programs on December 31, 2025, prompting ODM to convert to the FIDE-SNP model.
Next Generation RFA
The MyCare Ohio Program will convert to the Next Generation MyCare Ohio Program in January 2026. ODM is modeling portions of the program after the state’s Next Generation Medicaid managed care program. The Next Generation MyCare Ohio Program initially will be implemented in the 29 currently participating counties and then expand statewide, covering a total of 250,000 eligible individuals. Medicaid managed care organizations (MCOs) that serve the program will need to become CMS-approved FIDE-SNPs. MCOs awarded a Next Generation MyCare Ohio contract will need to notify CMS of their intent to establish a statewide FIDE-SNP in Ohio by fall 2024 to begin operations in January 2026.
ODM anticipates selecting up to four Next Generation MyCare Ohio MCOs to serve enrollees statewide, though a decision on the number of plans will be finalized as awards are made and based on what is most advantageous to the state.
MCOs will need to develop a member-focused strategy with care coordination as a priority. MCOs will also increase focus on behavioral health coordination. According to ODM, goals for the Next Generation program include:
Focusing on the individual
Improving individual and population wellness and health outcomes
Creating a personalized care experience
Supporting providers in continuously improving care
Improving care for people with complex needs to promote independence in the community
Increasing program transparency and accountability
Next Generation MyCare will advance these goals through a population health approach, designed to address inequities and disparities in care.
The program will enroll dually eligible individuals ages 21 and older. This is a change from the current program, which enrolls dual eligibles who are 18 years old and older. The eligible age increase is being made to align with the Medicaid early and periodic screening, diagnostic, and treatment (EPSDT) benefit.
The new program also will continue to offer all the same services available through Ohio’s home care, PASSPORT (long-term services and supports), and assisted living waivers.
Evaluation
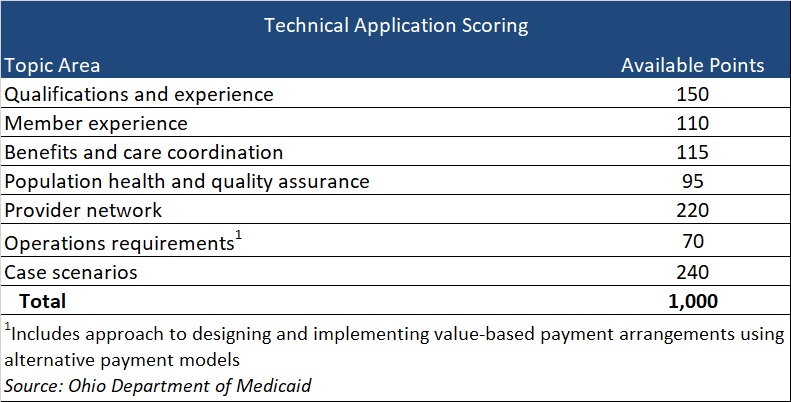
Applications initially will be reviewed to confirm the applicant meets the mandatory requirements. Applicants who meet the mandatory requirements will proceed to review and evaluation of responses to application questions that fall into seven topic areas, with a total of 1,000 available points (see Table 1). Of note, if an applicant is not currently serving as either a Next Generation MCO or a MyCare Ohio MCO, the applicant will receive zero points for qualifications and experience. Organizations that have yet to participate in at least one of these programs should consider the effect on their total score.
Table 1
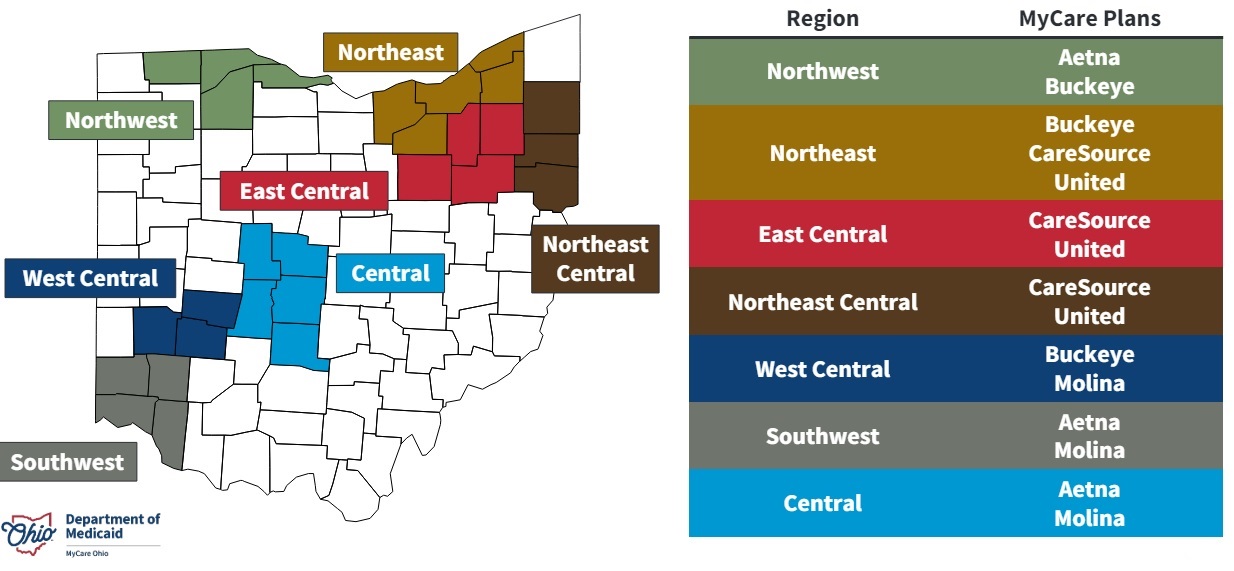
Current Market
Five MCOs—CVS/Aetna, CareSource, Centene/Buckeye, Molina, and United—participate in the current MCOP, with two or three of them participating in each of the seven regions.
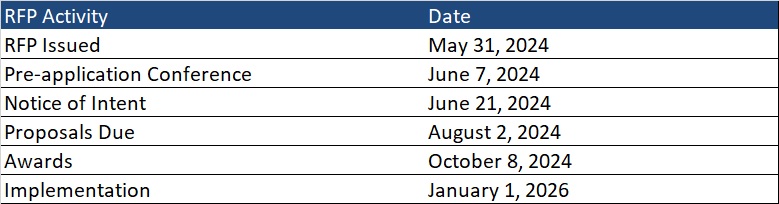
Timeline
MCOs should submit a notice of intent to apply by June 21. Proposals are due August 2, and awards will be issued October 8. Implementation is scheduled for January 1, 2026.
Ohio is one of several states transitioning from a FAI demonstration at the end of December 2025. Additionally, the 2025 Medicare Advantage Final Rule includes new policies affecting D-SNPs that could reshape the integrated care plan landscape in many states.
Health Management Associates (HMA) will host a webinar on June 20, 2024 titled “D-SNP growth and integration: key implications of the 2025 CMS final rule” to review the current landscape and federal changes that will affect D-SNPs in 2025 and beyond. The session will feature an analysis of the new regulations and a discussion of the critical strategic and product impacts on Medicare organizations that offer D-SNPs or are considering offering D-SNPs. Attendees also will have the opportunity to engage with the panelists during a Q&A session. Watch the replay now.
Contact our experts below for details about the nationwide D-SNP rules and landscape.
This week’s second In Focus reviews the Texas STAR Kids request for proposals (RFP), which the Texas Health and Human Services Commission released on May 10, 2024. The STAR Kids Medicaid managed care program provides coverage to children and youth ages 20 and younger with disabilities. Nine plans currently participate in the program, with contracts worth approximately $4 billion annually.
STAR Kids Overview
The STAR Kids program operates under the Texas Healthcare Transformation and Quality Improvement Program 1115 demonstration project. To be eligible, individuals must receive Supplemental Security Income (SSI) and SSI-related Medicaid, participate in the Medically Dependent Children Program (MDCP) Section 1915(c) waiver, live in a community-based intermediate care facility, or participate in an intellectual or developmental disability (I/DD) waiver program.
Medicaid managed care organizations (MCOs) provide acute, behavioral, and long-term services and supports (LTSS) to children in the MDCP program and acute services only to children covered under the other home and community-based services/IDD waivers.
RFP
Texas plans to award contracts to at least two MCOs for each of the 13 service areas (SAs). Each MCO can be awarded up to six SAs.
MCOs will need to describe reimbursement strategies that incentivize high-quality and cost-effective healthcare while controlling spending and reducing ineffective service utilization in their proposals.
MCOs must demonstrate progress toward advancing alternative payment model (APM) initiatives within an APM performance framework. MCOs will need to provide a proposed APM and a means of tracking its effectiveness, including implementation of processes that support and incentivize providers to apply value-based care models and reward high performers.
Evaluation
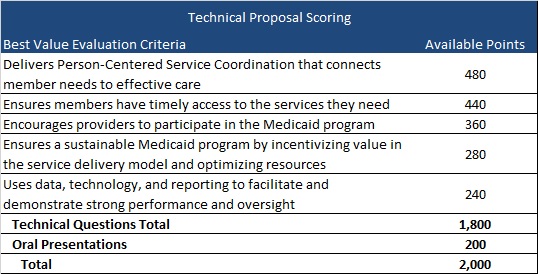
Technical questions in the proposals are divided into five broad categories, representing a total of 1,800 points. Plans can score up to 2,000 points, including oral presentations (see table below).
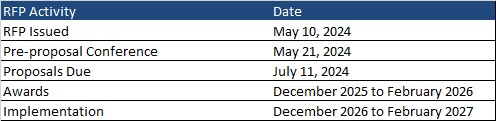
Timeline
Proposals are due July 11, with awards expected to be made between December 2025 and February 2026. The contract start date is anticipated to begin between December 2026 and February 2027. Contracts will run for six years with three two-year renewal options.
Current Market
Incumbents CVS/Aetna, Elevance/WellPoint, Blue Cross Blue Shield of Texas, Centene/Superior Health Plan, Community First Health Plan, Cook Children’s Health Plan, Driscoll Children’s Health Plan, Texas Children’s Health Plan, and UnitedHealthcare served 150,000 beneficiaries as of November 2023.
Connect With Us
Texas has an active Medicaid procurement schedule, with key deadlines and additional developments expected in the coming months. HMA experts in Texas are monitoring these activities as the state works to reprocure all its Medicaid managed care contracts. These programs include the State of Texas Access Reform (STAR) and CHIP for traditional Medicaid members, STAR+PLUS for members who are aged and disabled, and STAR Kids for individuals younger than 20 years old with disabilities.
Through HMA’s Information Services, subscribers gain access to detailed information about the Texas and other state RFP landscapes and procurement documents, as well as historical data about plan contracts, enrollment, and financials.
For more information about HMA’s work in Texas and our HMAIS resources, contact our featured experts.
Taken together, these two final rules create new flexibilities and requirements aimed at enhancing accountability for improving access and quality in Medicaid and the Children’s Health Insurance Program (CHIP) across the fee-for-service and managed care delivery systems and provide targeted regulatory flexibility in support of this goal.
HMA’s April 11, 2024, “What to Watch For” article outlined several proposed changes that CMS was poised to advance in the Medicaid managed care program. We focus today on the approved changes, including:
In lieu of services and settings (ILOSs)
The Medicaid and CHIP quality rating system (MAC QRS)
Medical loss ratios (MLRs)
Network adequacy
State directed payments (SDPs)
Following are HMA’s insights on the key takeaways in each of these major areas for states, managed care organizations (MCOs), providers, and other stakeholders. In addition, HMA experts will discuss the final rule during a LinkedIn Live on event at 2:00 pm (EDT) April 25, 2024. Go to the HMA LinkedIn feed to watch.
In future weeks, HMA will review the Ensuring Access to Care final rule.
ILOSs
The final rule makes clear that CMS remains committed to the conviction that ILOSs can play an important role in supporting state and MCO efforts to address many of the unmet physical, behavioral, developmental, long-term care, and other enrollee needs. At the same time, CMS continues to put forward requirements in this area to ensure adequate assessment of these substitute services and settings in advance of approval, ongoing monitoring for sufficient beneficiary protections, and financial accountability for related expenditures.
The final rule presents an opportunity to leverage ILOSs to improve population health, reduce health inequities, and lower total healthcare costs in Medicaid and CHIP, including by addressing unmet health-related social needs as well as through other avenues. To take full advantage of this opportunity, states and MCOs must ensure that that they are prepared to meet the accountability measures outlined in the final rule and partner with existing providers and community-based organizations that already provide such services and settings.
Medicaid and CHIP Quality Rating System
CMS finalized most proposed provisions related to mandatory quality measures, the process used to update these measures, the ability of states to include additional measures, and the ability of states to apply an alternative QRS if desired. On this last point, CMS is making several modifications to its MAC QRS proposal to clarify the scope of and to reduce the implementation resources needed for an alternative MAC QRS if a state elects to implement one.
States will be required to collect from MCOs the data necessary to calculate ratings for each measure and ensure that all data collected are validated. This will require MCOs to assess their capability to produce the mandated data upon request by states and, to the extent possible, to assess baseline performance on measures and proactively operationalize strategies to improve performance where necessary.
Medical Loss Ratios
The final rule aligns Medicaid and CHIP MLR QIA reporting requirements with the private market to ensure that only those expenses that are directly related to healthcare QIAs are included in the MLR numerator. CMS notes that this provision will allow for better MLR data comparisons between the private market and Medicaid and CHIP markets as well as reduce administrative burden for MCOs participating across these markets.
MCOs will need to model the impact of QIA expenditures that are no longer available for inclusion in the MLR numerator to ensure that a resulting failure to meet any minimum MLR requirements can be avoided, and, if it is projected to occur, a strategy can be developed and executed to avert the problem. CMS made this requirement effective as of the effective date of the final rule with no delay because it believes it is critical to the fiscal integrity of Medicaid and CHIP, adding urgency to MCO compliance action here.
Network Adequacy
The final rule makes clear that CMS has been persuaded that it needs to increase oversight of network adequacy and overall access to care through a new quantitative network adequacy standard. To measure network adequacy, the agency intends to implement wait time standards, complemented by secret shopper surveys to support enforcement.
Wait time standards and secret shopper surveys present opportunities for states, MCOs, and providers to collaborate to enhance access where needed and ensure compliance with the final rule. Undertaking secret shopper surveys ahead of implementation of the wait time standards (effective the first rating period beginning on or after three years after the effective date of the final rule) to determine the current performance relative to maximum wait times is a proactive step that is worth consideration by states and MCOs and can also be employed to foster dialogue with providers to address any areas of concern identified.
State Directed Payments
CMS is adopting its proposal in the final rule to use the average commercial rate as a limit for SDPs for inpatient and outpatient hospital services, nursing facility services, and professional services at academic medical centers. CMS believes that this approach represents a reasonable limit that is supportive of appropriate fiscal guardrails, while still affording states the flexibility to achieve SDP policy goals. States and providers will need to account for this requirement, along with others, as SDPs are developed going forward.
Connect with Us
HMA is ready to support your efforts to understand and take action to account for the managed care final rule’s effects on your state or organization’s strategy and operations. Please reach out to [email protected] to connect with our expert team members on this vital set of issues.
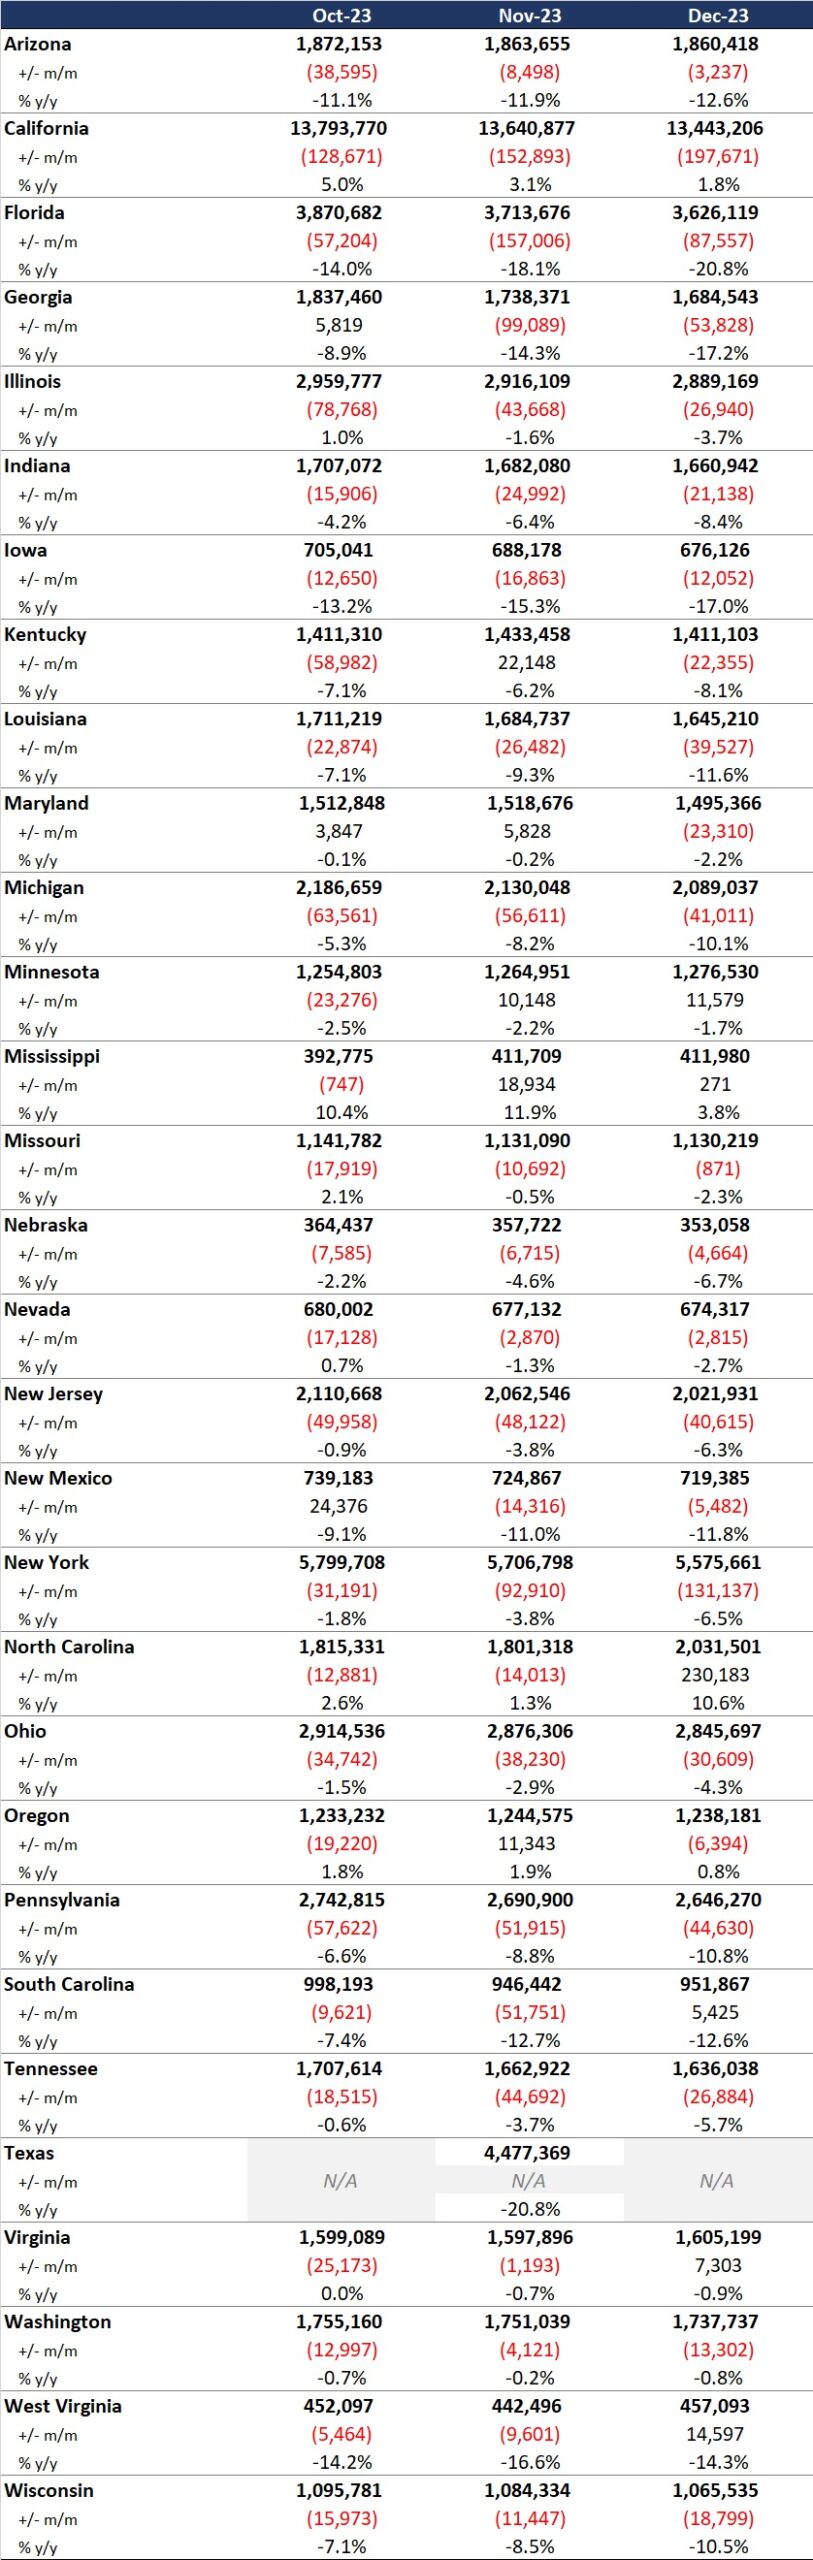
This week, our In Focus section reviews recent Medicaid enrollment trends in capitated, risk-based managed care in 30 states.1 Many state Medicaid agencies post monthly enrollment figures by health plan for their Medicaid managed care population on their websites. These data allow for timely analysis of enrollment trends across states and managed care organizations. All 30 states highlighted in this review have released monthly Medicaid managed care enrollment data into quarter four (Q4) of 2023. The analysis that follows reflects the most recent data posted. HMA continues tracking enrollment as states work towards concluding their Public Health Emergency (PHE) unwinding-related redeterminations and resuming normal eligibility operations.
Health Management Associates, Inc., (HMA) has reviewed the Q4 enrollment data (see Table 1) and offers the following observations:
Across the 30 states tracked in this report, Medicaid managed care enrollment declined by 7.3 percent year-over-year as of December 2023.
Of the 30 states, 26 experienced decreased enrollment in December 2023, compared with the previous year, as the result of Medicaid redeterminations.
A total of 23 of the states—Arizona, California, Illinois, Indiana, Iowa, Kentucky, Louisiana, Maryland, Michigan, Minnesota, Missouri, Nebraska, Nevada, New Jersey, New Mexico, New York, North Carolina, Ohio, Oregon, Pennsylvania, Virginia, Washington, and West Virginia—saw net Medicaid managed care enrollment decrease by 469,000 (0.9%) to 51.5 million members at the end of Q4 2023. (Note: North Carolina expanded Medicaid in December 2023 and was added to the expansion group, in part inflating the change).
The seven states that had yet to expand Medicaid as of December 2022—Florida, Georgia, Mississippi, South Carolina, Tennessee, Texas, and Wisconsin—have seen Medicaid managed care enrollment decrease 25.2 percent to 13.9 million members at the end of Q4 2023.
Table 1. Monthly MCO Enrollment by State, October 2023−December 2023
Note: In Table 1, “+/- m/m” refers to the enrollment change from the previous month. “% y/y” refers to the percentage change in enrollment from the same month in the previous year.
It is important to note the limitations of the data presented. First, not all states report the data at the same time during the month. Some of these figures reflect beginning of the month totals, whereas others provide an end of the month snapshot. Second, in some cases the data are comprehensive in that they cover all state-sponsored health programs offering managed care; in other cases, the data reflect only a subset of the broader managed Medicaid population, making it the key limitation to comparing the data described below and figures that publicly traded Medicaid MCOs report. Consequently, the data in Table 1 should be viewed as a sampling of enrollment trends across these states rather than a comprehensive comparison, which cannot be developed based on publicly available monthly enrollment information.
Expand Your Awareness about Medicaid and Medicare Advantage via HMAIS
If you are interested in gaining access to detailed information on the Medicaid managed care landscape, an HMAIS subscription is the key to unlock important data. The HMA Information Services (HMAIS) collects Medicaid and Medicare Advantage Special Needs Plan (SNP) enrollment data, health plan financials, as well as developments on expansions, waivers, and demonstrations. Your HMAIS login also provides access to a library of public documents all in one place, including Medicaid RFPs, responses, model contracts, scoring sheets and other procurement related materials. HMAIS combines this publicly available information along with HMA expert insights on the structure of Medicaid in each state, as well as a proprietary HMA Medicaid Managed Care Opportunity Assessment.
For information on how to subscribe to HMA Information Services, contact our featured experts.
The policy changes are expected to fall into the following major categories: in lieu of services (ILOS), the Medicaid and CHIP Quality Rating System (MAC QRS), medical loss ratios (MLRs), network adequacy, and state directed payments (SDPs). These revised policies will affect Medicaid coverage and reimbursement for years to come. Following is a summary of the proposed policy changes to watch for in the final rule.
ILOS
CMS has proposed to expand upon and codify the sub-regulatory guidance around ILOS outlined in State Medicaid Director Letter #23-001. The letter advised state that they have the option to use the ILOS authority in Medicaid managed care programs to reduce health disparities and address unmet health-related social needs, such as housing instability and nutrition insecurity. The final rule would expand upon and codify that guidance.
For example, although the ILOS proposal adds reporting requirements and guardrails to address fiscal accountability, the proposed rule also noted that the substitution of an ILOS for a state plan service or setting should be cost-effective but does not need to meet budget neutrality requirements. States are also permitted to specify that an ILOS can be an immediate or longer-term substitute for a state plan service or setting.
MAC QRS
CMS has proposed a MAC QRS framework that includes: (1) mandatory quality measures, (2) a quality rating methodology, and (3) a mandatory website display format. State Medicaid agencies and managed care organizations (MCOs) will be required to adopt and implement the MAC QRS framework that CMS develops or adopt and implement an alternative but equivalent managed care quality rating system. CMS will update the mandatory measure set at least every two years. Any planned modifications to measures will be announced publicly through a call letter or similar guidance, with measures based on: (1) value in choosing an MCO; (2) alignment with other CMS programs; (3) the relationship to enrollee experience, access, health outcomes, quality of care, MCO administration, or health equity; (4) MCO performance; (5) data availability; and (6) scientific acceptability.
State Medicaid agencies will be required to collect from MCOs the data necessary to calculate ratings for each measure and ensure that all data collected are validated. In addition, state Medicaid agencies will be expected to calculate and issue ratings to each MCO for each measure.
Lastly, state websites will be required to contain the following elements: (1) clear information that is understandable and usable for navigating the website itself; (2) interactive features that allow users to tailor specific information, such as formulary, provider directory, and ratings based on their entered data; (3) standardized information so that users can compare MCOs; (4) information that promotes beneficiary understanding of and trust in the displayed ratings, such as data collection timeframes and validation confirmation; and (5) access to Medicaid and CHIP enrollment and eligibility information, either directly on the website or through external resources.
MLRs
CMS has proposed three areas for revision to its existing MLR standards, which require MCOs to submit annual MLR reports to states, which, in turn, must provide CMS with an annual summary of those reports. Areas for revision include: (1) requirements for clinical or quality improvement standards for provider incentive arrangements, (2) prohibited administrative costs in quality improvement activity (QIA) reporting, and (3) additional requirements for expense allocation methodology reporting.
With regard to provider incentive arrangements, CMS proposes to require that contracts between MCOs and providers: (1) have a defined performance period that can be tied to the applicable MLR reporting period(s), (2) include well-defined quality improvement or performance metrics that the provider must meet to receive the incentive payment, and (3) specify a dollar amount that can be clearly linked to successful completion of these metrics as well as a date of payment. MCOs would be required to maintain documentation that supports these arrangements beyond attestations.
In terms of QIA reporting, CMS proposes to explicitly prohibit MCOs from including indirect or overhead expenses when reporting QIA costs in the MLR. CMS also intends to add requirements regarding how MCOs can allocate expenses for the purpose of calculating the MLR by requiring MCOs to offer a detailed description of their methodology.
Network Adequacy
CMS has proposed a range of new network adequacy requirements intended to improve timely access to care for managed care enrollees. Those related to appointment wait time standards and secret shopper surveys are among the most prominent.
For appointment wait time standards, CMS proposes that state Medicaid agencies develop and enforce wait times associated with routine appointments for four types of services: (1) outpatient mental health and substance use disorder (SUD) for adults and children, (2) primary care for adults and children, (3) obstetrics and gynecology (OB/GYN), and (4) an additional service type determined by each state Medicaid agency using an evidence-based approach. The maximum wait times must be no longer than 10 business days for routine outpatient mental health and SUD appointments and no more than 15 business days for routine primary care and OB/GYN appointments. State Medicaid agencies could impose stricter wait time standards but not more lax ones. The wait time standard for the fourth service type will be determined at the state level.
State Medicaid agencies also will be required to engage an independent entity to conduct annual secret shopper surveys to validate MCO compliance with appointment wait time standards and the accuracy of provider directories to identify errors, as well as providers that do not offer appointments. For an MCO to be compliant with the wait time standards, as assessed through the secret shopper surveys, it would need to demonstrate a rate of appointment availability that meets the wait time standards at least 90 percent of the time.
SDPs
CMS has proposed several important changes to the requirements governing the use of SDPs, strengthening both the accountability required of and flexibility afforded to states. For example, CMS proposes to require that provider payment levels for inpatient and outpatient hospital services, nursing facility services, and the professional services at an academic medical center not exceed the average commercial rate. Furthermore, states would be required to condition SDPs upon the delivery of services within a contract rating period and prohibited from using post-payment reconciliation processes.
With regard to flexibility, CMS proposes to remove unnecessary regulatory barriers to support the use of SDPs by states to implement value-based payment arrangements and include non-network providers in SDPs. The proposal also permits states to implement, without prior approval, minimum fee schedules in Medicaid consistent with Medicare provider rates.
What’s Next
CMS is expected to publish the final rule in April. In addition, CMS plans to publish a separate final rule addressing new regulations pertaining to access to care, which will have equally significant impacts on states, MCOs, and providers. If you have questions about how HMA can support your efforts related to the managed care final rule’s implications and the context of other federal regulations for states, MCOs, or providers, contact our featured experts.
The final rule is anticipated to include policy changes in several major areas. These include in lieu of services (ILOS), the Medicaid and CHIP Quality Rating System (MAC QRS), medical loss ratios (MLRs), network adequacy, and state directed payments. When taken together, the policymaking in each of these areas represents the start of a new era of accountability and transparency in the Medicaid program and will affect Medicaid coverage and reimbursement for years to come.
HMA is on the alert for the final rule and will provide analysis and expertise relevant to states, MCOs, and providers, both before and following its release. Whether it is understanding the opportunities to leverage ILOS to address health-related social needs, ensuring operational readiness for data collection and calculation obligations for the MAC QRS, or preparing to comply with MLR requirements related to provider incentive arrangements and quality improvement activity reporting, as well as a host of other topics, HMA will be able to provide insight.
For More Information
If you have questions about how HMA can support your efforts related to the final rule’s implications for states, MCOs, or providers, please contact our featured experts.
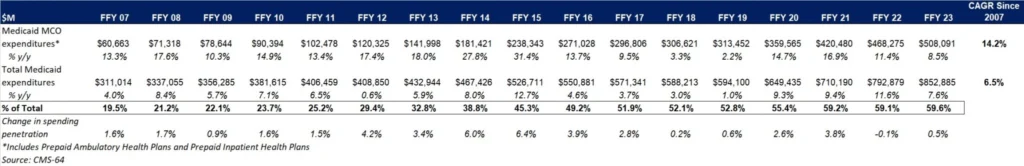
This week, our In Focus section analyzes preliminary 2023 Medicaid spending data collected in the annual CMS-64 Medicaid expenditure report. After submitting a Freedom of Information Act request to the Centers for Medicare & Medicaid Services (CMS), HMA received a draft version of the CMS-64 report that is based on preliminary estimates of Medicaid spending by state for federal fiscal year (FFY) 2023. Based on the preliminary estimates, Medicaid expenditures on medical services across all 50 states and six territories in FFY 2023 totaled nearly $852.9 billion, with 59.6 percent of that amount now flowing through Medicaid managed care programs. In addition, total Medicaid spending on administrative services was $33.8 billion, bringing total program expenditures to $886.7 billion.
Total Medicaid Managed Care Spending
Total Medicaid managed care spending (including the federal and state share) in FFY 2023 across all 50 states and six territories was $508.1 billion, up from $468.3 billion in FFY 2022. This figure includes spending on comprehensive risk-based managed care programs as well as prepaid inpatient health plans (PIHPs) and prepaid ambulatory health plans (PAHPs). PIHPs and PAHPs refer to prepaid health plans that provide only certain services, such as dental or behavioral health care. Fee-based programs such as primary care case management (PCCM) models are not included in this total. Following are some key observations.
Total Medicaid managed care spending grew 8.5 percent in FFY 2023.
Managed care spending growth has decreased in since the end of the COVID-19 pandemic, after peaking in FFY 2021.
In terms of dollars, the increase in Medicaid managed care spending from FFY 2022 to FFY 2023 was $39.8 billion, compared with $47.8 billion from FFY 2021 to FFY 2022.
Medicaid managed care spending has increased at a compounded annual growth rate (CAGR) of 14.2 percent since FFY 2007, compared with a 6.5 percent growth in total Medicaid spending.
Compared with FFY 2022, Medicaid managed care spending as a percent of total Medicaid spending in FFY 2023 increased by 0.5 percentage points to 59.6 percent.
Table 1. Medicaid MCO Expenditures as a Percentage of Total Medicaid Expenditures, FFY 2007−2023 ($M)
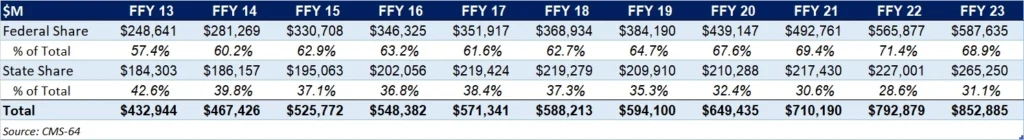
As the table below indicates, 68.9 percent of FFY 2023 spending came from federal sources, which is 11.5 percentage points higher than the pre-Medicaid expansion share in FFY 2013 and 1.3 percentage points higher than FFY 2020.
Table 2. Federal versus State Share of Medicaid Expenditures, FFY 2013−2023 ($M)
State-Specific Growth Trends
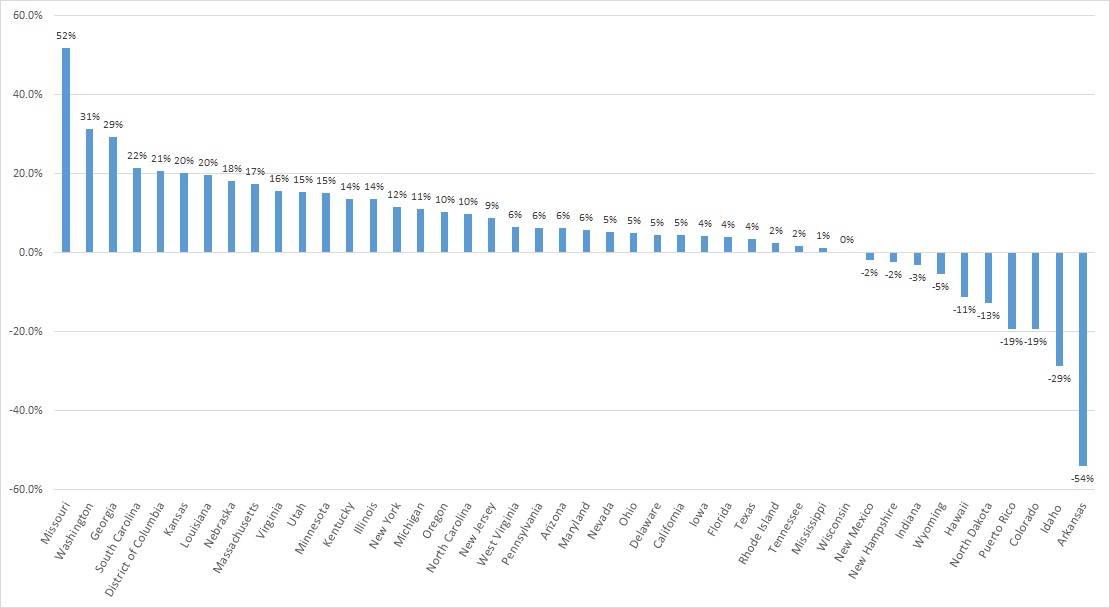
A total of 44 states and territories report managed care organization (MCO) spending in the CMS-64 report. Average MCO spending during FFY 2023 increased 8.5 percent. On a percentage basis, Missouri experienced the highest year-over-year growth in Medicaid managed care spending at 51.7 percent, followed by Washington at 31.4 percent and Georgia at 29.3 percent.
The chart below provides additional detail on Medicaid managed care spending growth in states with risk-based managed care programs in FFY 2023.
Figure 1. Medicaid Managed Care Spending Growth on a Percentage Basis by State, FFY 2022-2023
Source: CMS-64; *Note: Not all states are included in the table.
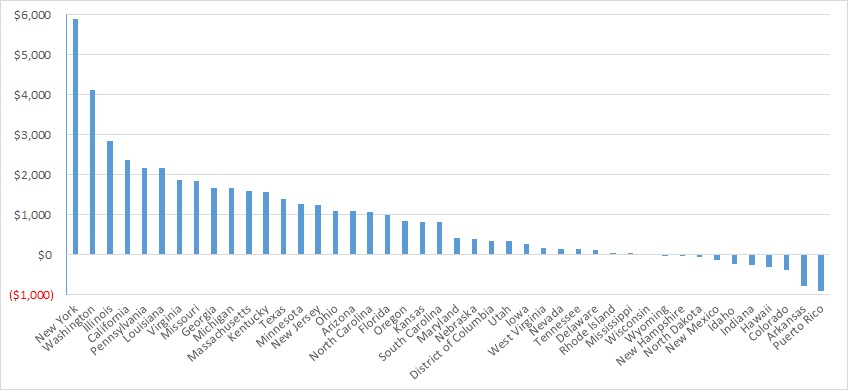
Looking at year-over-year spending growth in terms of dollars, New York experienced the largest increase in Medicaid managed care spending at $5.9 billion. Other states with significant year-over-year spending increases included Washington ($4.1 billion), Illinois ($2.8 billion), and California ($2.4 billion). The chart below illustrates the year-over-year change in spending across the states.
Figure 2. Medicaid Managed Care Spending Growth on a Dollar Basis by State, FFY 2022−2023 ($M)
Source: CMS-64; *Note: Not all states are included in the table.
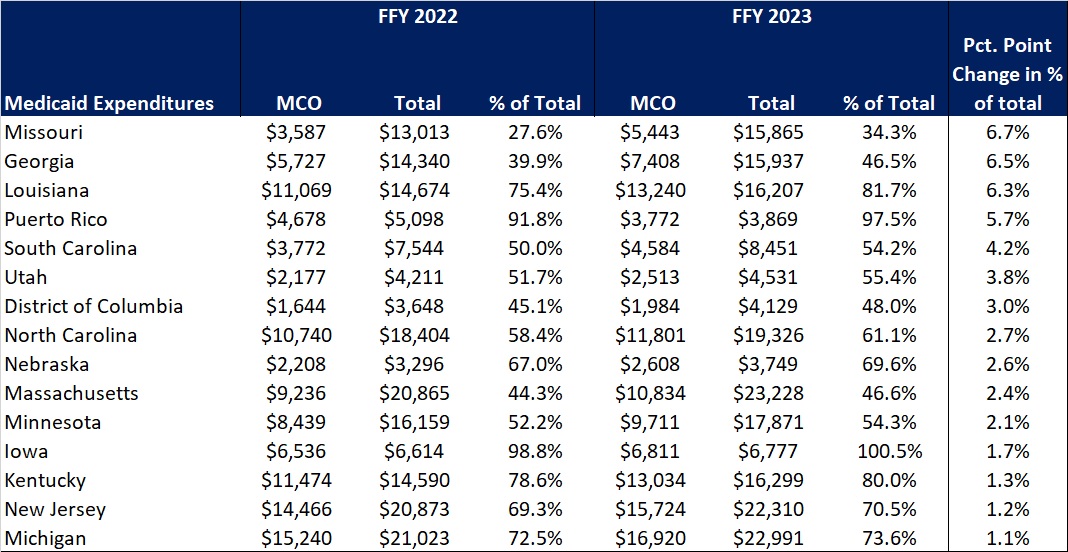
The percentage of Medicaid expenditures directed through risk-based Medicaid MCOs increased by more than one percentage point in 15 states from FFY 2022 to FFY 2023. The managed care spending penetration rate rose 6.7 percentage points in Missouri, 6.5 percentage points in Georgia, 6.3 percentage points in Louisiana, and 5.7 percentage points in Puerto Rico. In all, 22 states saw a decrease in managed care penetration from FFY 2022 to FFY 2023.
Table 3. Medicaid MCO Expenditures as a Percentage of Total Medicaid Expenditures in States with a One percent or Greater Increase from FFY 2022 to FFY 2023 ($M)
Source: CMS-64 Note: Washington was excluded from the data table.
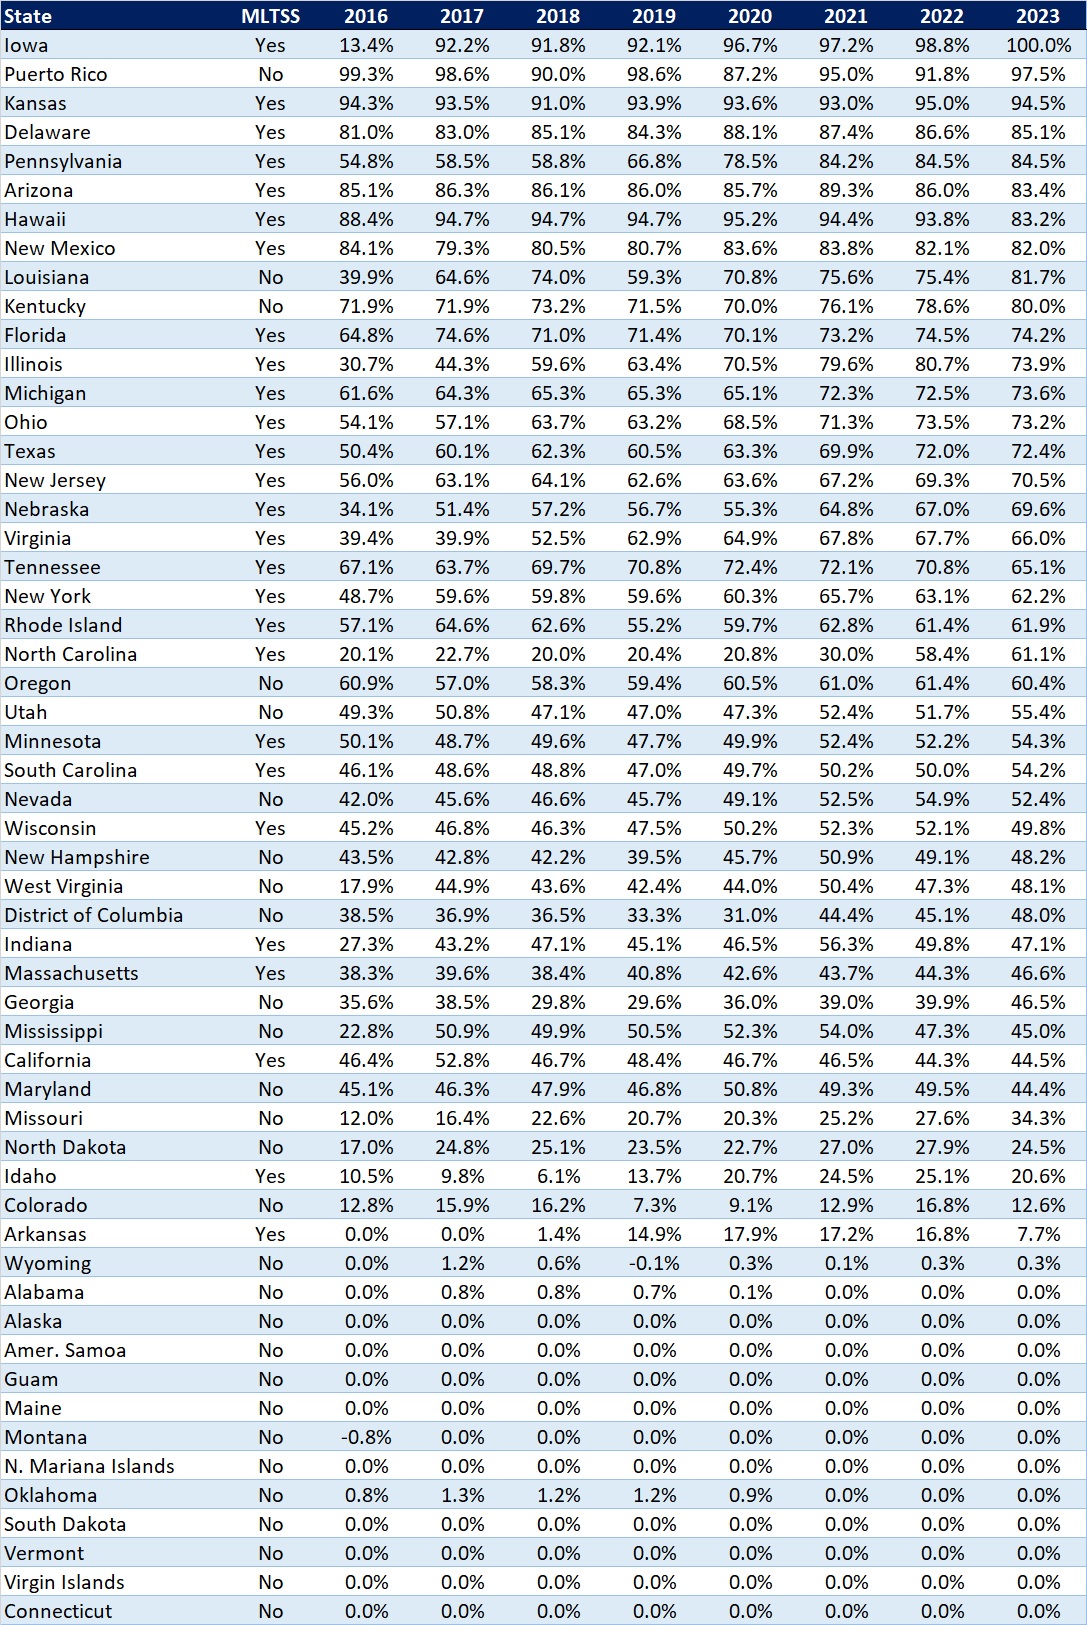
The table below ranks the states and territories by the percentage of total Medicaid spending through Medicaid MCOs. Iowa reported the highest percentage at 100 percent, followed by Puerto Rico at 97.5 percent and Kansas at 94.5 percent.
In many states, certain payment mechanisms may never be directed through managed care, such as supplemental funding sources for institutional providers and spending on retroactively eligible beneficiaries. As a result, the maximum achievable penetration rate in each state will vary and may be below the amount achieved in other states. The Medicaid managed care spending penetration rate is greatly influenced by the degree to which states have implemented managed long-term services and supports (MLTSS) programs.
Table 4. Medicaid MCO Expenditures as a Percent of Total Medicaid Expenditures, FFY 2016-2023
Source: CMS-64 Note: Washington was excluded from the data table.
If you’re interested in becoming an HMAIS subscriber and for access to the CMS-64 data, contact our expert below.
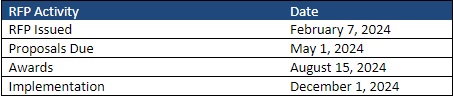
This week, our In Focus section reviews the statewide North Carolina request for proposals (RFP) for the new Children and Families Specialty Plan (CFSP), which the North Carolina Department of Health and Human Services (DHHS) released on February 7, 2024. The plan will provide physical health, behavioral health, intellectual and developmental disability, long-term care, and pharmacy services to children, youth, and families that the child welfare system serves. Implementation is scheduled for December 1.
Background
North Carolina implemented Medicaid managed care on July 1, 2021, after working on a plan to transition individuals from fee-for-service to managed care since 2015. CFSP is one of the four types of integrated Medicaid managed care plans the state will contract with to serve Medicaid beneficiaries. The other three are Standard Plans, the Behavioral Health and Intellectual/Developmental Disability (BH IDD) Tailored Plans, and the Eastern Band of Cherokee Indians Tribal Option.
Standard Plans are operated by one of two types of Medicaid managed care organizations (MCOs): statewide commercial plans (CPs) or regional provider-led entities (PLEs). The state awarded contracts to four CPs, the maximum allowed under the procurement, and one PLE. AmeriHealth Caritas North Carolina, Blue Cross and Blue Shield of North Carolina, UnitedHealthcare of North Carolina, and WellCare of North Carolina serve beneficiaries across six Medicaid managed care regions. A regional contract with provider-led Carolina Complete Health, a partnership between the North Carolina Medical Society and Centene, covers Regions 3, 4, and 5. The total value of the contracts is approximately $6.4 billion. The plans serve more than 2 million members as of year-end 2023.
The state plans to implement BH IDD Tailored Plans July 1. Tailored plans will be provided through the awarded local management entity-managed care organizations (LME-MCOs): Alliance Health, Partners Health Management, Trillium Health Resources, and Vaya Health. Implementation has been delayed multiple times since 2022. As a result, the state issued a directive last year to dissolve the Sandhills Center and consolidate Eastpointe and Trillium Health Resources to hasten the delayed rollout. The tailored plans are expected to cover approximately 160,000 beneficiaries.
Details about the CFSP
The following populations will be enrolled automatically in CFSP:
Beneficiaries who are in foster care
Beneficiaries who are receiving adoption assistance
Beneficiaries enrolled in the former foster youth eligibility group
The minor children of enrolled parents
The following populations will be eligible for enrollment in CFSP during contract year two:
Parents, caretaker relatives, guardians and custodians with children in foster care
Minor siblings of beneficiaries in foster care
Adults identified on an open Child Protective Services (CPS) In-Home Family Services Agreement case and any minor children living in the same household
Adults identified in an open Eastern Band of Cherokee Indians Department of Public Health and Human Services Family Safety program case and any children living in the same household
Any other beneficiary that has been involved with the child welfare system who could benefit from enrollment
RFP
The state will award the contract to a single statewide managed care plan. Applicant MCOs will need to develop strategies for engaging with historically marginalized populations, addressing health disparities, and incorporating health equity. Technical proposals will be evaluated based on the following criteria:
Medicaid Managed Care Qualifications and Experience
Medicaid Managed Care Program Administration
Administration and management
Program operations
Claims and encounter management
Financial requirements
Compliance
Technical specifications
Historically underutilized businesses
Diversity, equity, and inclusion
Integrated and Coordinated Delivery of Services
Members and recipients
Benefits and services
Providers
Stakeholder engagement
Comprehensive Care Management
Care management
Quality and value
Timeline
The CFSP data book and capitation rate methodology will be released March 1, with an overview for presentation at a pre-proposal conference on March 7. Proposals are due May 1 and awards are expected to be announced August 15. Contracts are scheduled to run December 1, 2024, through June 30, 2028, with one additional option year. The RFP indicates that the Department will work with awardee to establish an appropriate launch date.
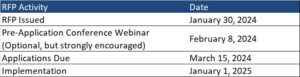
This In Focus section reviews the request for applications (RFA) that the Commonwealth of Pennsylvania Department of Human Services (DHS) released January 30, for the Community HealthChoices (CHC) Program. CHC is the mandatory managed long-term services and supports (MLTSS) program, which serves five CHC zones that cover all 67 counties in the commonwealth.
Notably, this procurement, as compared to the original CHC procurement in 2018, has increased emphasis on innovative approaches to address health equity and the Social Determinates of Health (SDOH). The health equity focus goes beyond traditional health-related social needs such as access to housing, transportation, food, and employment, and addresses some SDOHs that have a particular impact on the CHC population, such as environmental conditions and addressing hazardous or unsafe living conditions.
Behavioral health remains carved-out to separate behavioral health managed care organizations (BH-MCOs). Instead, CHC applicants will need to articulate how they will coordinate with the BH-MCOs to ensure access to appropriate BH services, which continues to be an area of significant interest for state Medicaid officials.
Background
The CHC Program serves individuals who are dually eligible for Medicare and Medicaid and people with physical disabilities who receive home and community-based waiver services or nursing facility care.
Participants may receive LTSS in the community or in a nursing facility.
CHC is the sole program option for fully dual eligible beneficiaries and most nursing facility clinically eligible (NFCE) individuals who reside in the five zones. The regional CHC zones are as follows:
Medicaid managed care organizations (MCOs) may submit applications for one or more zones. Applications are due March 15, 2024. The department anticipates awarding agreements to three to five CHC-MCOs in each of the five CHC zones. Selected applicants must provide CHC services in all counties in the zone(s) for which they are selected to participate and improve the accessibility, continuity, and quality of services for participants in the CHC program. The contract will run for five years and will have three one-year renewal options.
DHS indicates that the awarded CHC-MCOs must have an aligned dual-eligible special needs plan (D-SNP) and a current Medicare Improvement for Patients and Providers Act (MIPPA) agreement with the department. The aligned D-SNP must be operational and the MIPPA agreement must be in place by the anticipated implementation date (January 1, 2025).
DHS indicates selected MCOs must be as flexible and adaptable as possible and demonstrate the ability to coordinate services for multiple populations and across multiple programs, including programs with a focus that is broader than the delivery of healthcare services and LTSS.
Other RFA highlights include the following:
Does not require a cost submittal.
Includes small diverse business (SDB) or veteran business enterprise (VBE) goals of 11 percent and 3 percent respectively. Applicants must include separate SDB and VBE submittals for each zone in its application.
Includes a contractor partnership program (CPP) which requires entities that are awarded a contract or agreement with DHS to establish a hiring target to support Temporary Assistance for Needy Families (TANF) beneficiaries in obtaining employment with the contractor, grantee, or their subcontractors.
Notably, DHS has provided itself flexibility within the RFA to implement a pay-for-performance incentive to MCOs. Under this policy, DHS could make incentives available to MCOs that help participants successfully complete the financial eligibility redetermination process with their local County Assistance Offices (CAOs). The department may implement additional pay-for-performance incentives in later years.
Timeline
Evaluation
For an applicant to be considered responsible for this RFA and eligible for selection of best and final offers (BAFOs) and negotiations:
The total score for the technical submittal of the application must be greater than or equal to 75 percent of the available raw technical points
The applicant’s financial information must demonstrate that the organization possesses the financial capacity to fulfill the good faith performance of the agreement
The evaluation committee will evaluate technical submittals for each zone separately. For each zone, DHS must select for negotiations the applicants with the highest overall score. The weight for the technical criterion is 100 percent of the total available points. Technical evaluation will be based on soundness of approach, applicant qualifications, personnel qualifications, and understanding the project.
The final technical scores will be determined by giving the maximum number of technical points available to the application with the highest raw technical score. The remaining applications will be rated by applying the formula located at RFP Scoring Formula.
Financial information will not be scored as part of the technical submittal. It will be reviewed only to determine an applicant’s financial responsibility.
SDB and VBE participation submittals will not be scored, however, if an applicant fails to satisfy the SDB or VBE requirements described, and DHS will reject the application.
DHS will not score the CPP submittal. Once an applicant has been selected for negotiations, DHS will review the CPP submittal.
Current Market
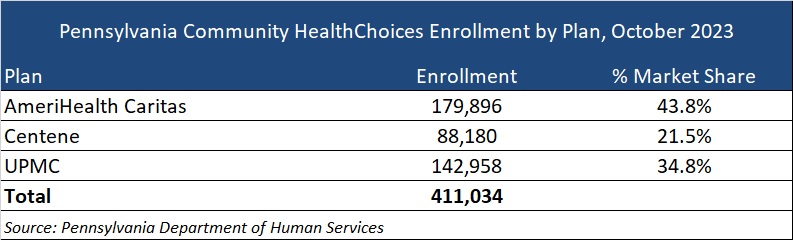
The CHC incumbents are AmeriHealth Caritas, Centene, and University of Pittsburgh Medical Center (UPMC), serving 411,034 CHC members as of October 2023.
Want to know more about how the next phase of Community Health Choices will impact your organization?
HMA’s Pennsylvania-based teams can assist organizations seeking to understand the implications of this important procurement, key program changes and what the outcome may mean for providers, community base organizations, and other stakeholders. Please contact Dianne Bisacky with questions or if you are seeking more detailed analysis of this procurement or the Community Health Choices program generally.
Nine States to Participate in Children’s Behavioral Health Policy Lab
LANSING, MICH. – Health Management Associates (HMA), in partnership with the Annie E. Casey Foundation, Casey Family Programs, National Association of State Mental Health Program Directors (NASMHPD), the Child Welfare League of America (CWLA), the American Public Human Services Association (APHSA), National Association of Medicaid Directors (NAMD) and the Centene Foundation, will convene a Children’s Behavioral Health (CBH) State Policy Lab, Feb. 7-9 in Baltimore. HMA today announced that Georgia, Kansas, Kentucky, Maryland, Missouri, Pennsylvania, Texas, Utah, and Wisconsin will participate in the policy lab. MITRE, which previously hosted a related federal convening, will also take part in this state convening.
This pioneering effort, made possible by the partner organizations, aims to convene state interagency teams – including child welfare, juvenile justice, behavioral health, Medicaid, and K-12 public education – to collectively strategize, learn from innovators in the sector and promote cross-system alignment to drive outcomes for children, youth, and families.
COVID-19 has exacerbated long-standing system collaboration challenges across state child welfare, behavioral health, and Medicaid that lead to unsatisfactory outcomes for the most vulnerable children in our communities. Most worrisome is the worsening of behavioral and physical health challenges and trauma because of uncoordinated or fragmented care. This lack of coordinated strategy and policy leads to higher costs of treatment and also increasingly exposes states and local jurisdictions to threats or filings of class action lawsuits, and related settlements or those arising from Department of Justice investigations. Fortunately, federal and state efforts and investments to address the youth systems of care – including schools, community, delivery systems, and community-based child placing agencies – are in motion.
In November, a call for applications was released to U.S. states and territories for potential participation in the State Policy Lab. Applicants were required to identify demonstrated need, existing state agency governance structures focused on children and youth, technical assistance needs, and outcomes for attending the policy lab. The applications required demonstrated participation from Medicaid, child welfare and behavioral health agencies; a commitment to creating sustainable interagency solutions for children, youth, and their families and had to certify formal support from the Governor/Cabinet level.
An external independent panel reviewed applications for state agency participation using a standardized rubric that covered four domains:
Gaps and opportunities analysis
Intent of collaborative partnerships
Approach to engagement of youth and adults with lived experience
Imminent risks to public agency operations as a result of poor outcomes for children, youth, and their families
This convening is aimed at assisting child welfare, juvenile justice, behavioral health, Medicaid, and K-12 public education where possible to build upon existing efforts to improve outcomes for children, youth, and families, strategically layering on missing components and promoting alignment between them and with other agency priorities. Examples of what could be co-designed with state partners:
Build a shared strategic vision for a comprehensive continuum of care that ensures access to the “right service, at the right time based on individual and family need.” This vision can strengthen prevention initiatives and ensure the full array of evidence-based community-based interventions including use of crisis response and stabilization models.
Develop policies and strategies for improving the engagement of children, youth, and families with lived experiences to the “right part of the system for the right level of care,” agnostic of the door through which they enter any coordinated child serving system, while ensuring that all aspects of this system are anchored in equity.
Following the event, learnings and findings will be disseminated to help states and counties adopt innovative solutions to improve outcomes for children, youth, and their families.
Within the healthcare sector, there is an imperative for a comprehensive understanding of the care delivery framework that will positively impact outcomes, equity, and the overall health of communities. Among the drivers for this imperative is renewed focus among Medicare officials and interest from states and employers to transition to alternative payment methods that focus on value for payers and patients. A variety of care delivery structures and metrics can be used, and all have a role in driving value-based care (VBC).
One critical element of VBC hinges on whether and how healthcare organizations focus their care delivery structures on patients. VBC also incorporates metrics that further validate the ability of the system to positively impact patient outcomes, reduce health disparities, and improve population health. Emphasizing technology, interdisciplinary collaboration, and streamlined communication can revolutionize the care delivery model.
The HMA workshop-style spring conference on March 5 and 6, is designed to delve deeply into the intricacies of these care delivery frameworks and metrics within the context of VBC. This unique workshop will challenge attendees to roll up their sleeves and actively engage to become part of the solution through an interactive conversation, allowing participants to discuss real-world scenarios, analyze data and metrics and, using small-group breakout sessions, engage in focused and in-depth knowledge sharing.
Break-out sessions facilitated and led by subject matter experts will challenge attendees to identify new solutions around care delivery structures and contractual metrics that improve outcomes, that may include:
Engaging providers around consistent approaches to enhance patient outcomes, optimize treatment plans, and ensure the delivery of evidence-based, high-quality care.
Developing approaches for patient engagement that improve care delivery and foster active involvement and collaboration between patients and healthcare providers.
Crafting strategies for seamless coordination among healthcare providers, spanning sectors, and involving non-traditional providers and community organizations.
Understanding components of effective provider network agreements and how they contribute to achieving healthcare goals through strong partnerships and collaborations.
The workshop promises to be a dynamic platform for professionals in the healthcare sector, offering valuable insights, practical strategies, and collaborative opportunities to secure a place for high-quality value-based care. By focusing on care delivery structures, patient engagement, care coordination services, and provider network agreements, attendees will be well-equipped to navigate the complexities of healthcare and contribute to a healthier, more equitable future.
To learn more about the HMA 2024 Spring Conference Workshop and to register, visit the conference website.