Previously, HMA reviewed the provisions of the Medicaid and Children’s Health Insurance Program (CHIP) managed care access, finance, and quality proposed rule published by the Centers for Medicare & Medicaid Services (CMS) on May 3, 2023. CMS is accepting comments on the proposed rule through July 3, 2023. While the proposed rule, if finalized as put forward, will have a significant impact across Medicaid stakeholders including enrollees, managed care organizations (MCOs), providers, and state Medicaid agencies, this blog post outlines three specific aspects of the proposed the rule and their implications for a subset of MCOs: regional and local MCOs.
Medical Loss Ratio (MLR) Standards
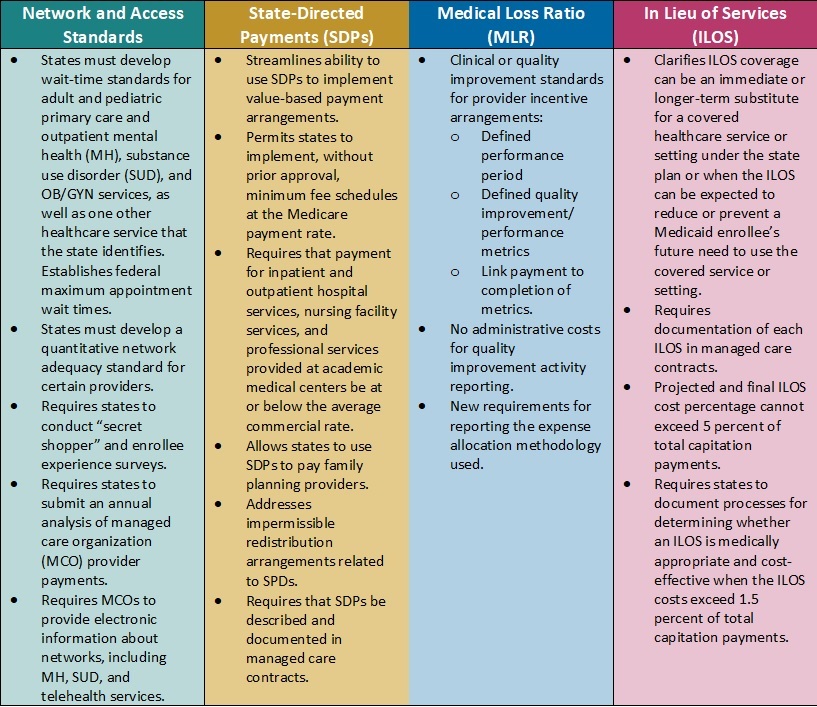
In the proposed rule, CMS outlines three areas for revisions to its existing MLR standards which require MCOs to annually submit MLR reports to states and require states, in turn, to annually provide a summary of those reports to CMS. An MLR is calculated by adding the expenditures for incurred claims to the expenditures for activities that improve health care quality and fraud prevention activities (the numerator) and dividing this by adjusted premium revenue (the denominator). The three areas where CMS proposes revisions include: (1) requirements for clinical or quality improvement standards for provider incentive arrangements, (2) prohibited administrative costs in quality improvement activity (QIA) reporting, and (3) additional requirements for expense allocation methodology reporting.
Related to provider incentive arrangements (which are considered part of incurred claims), CMS proposes to require that contracts between MCOs and providers: (1) have a defined performance period that can be tied to the applicable MLR reporting period(s), (2) include well-defined quality improvement or performance metrics that the provider must meet to receive the incentive payment, and (3) specify a dollar amount that can be clearly linked to successful completion of these metrics as well as a date of payment. Furthermore, MCOs would be required to maintain documentation to support these arrangements and cannot rely upon attestations as documentation of compliance.
Related to QIA reporting, CMS proposes to explicitly prohibit MCOs from including indirect or overhead expenses when reporting QIA costs in the MLR. CMS notes that today, for example, expenditures for facility maintenance, marketing, or utilities may be included in the MLR even though such expenses do not directly improve health care quality. From the perspective of CMS, the inclusion of such expenditures in the MLR numerator may be resulting an inflated MLRs that then provide a distorted view of MCO performance.
Related to expense allocating reporting, CMS proposes to add requirements regarding how MCOs can allocate expenses for the purpose of calculating the MLR. Specifically, MCOs would need to describe in their methodology a detailed description of the methods used to allocate expenses, including incurred claims, quality improvement expenses, federal and state taxes and licensing or regulatory fees, and other non-claims costs. The goal of requiring this additional detail is to give state Medicaid agencies the ability to assess whether MLRs are accurately represented as a result of the methodology employed by an MCO to allocate expenses across lines of business (e.g., Marketplace, Medicaid, and Medicare).
For local and regional MCOs, the changes to MLR standards proposed by CMS will require meaningful efforts to ensure compliance. Provider incentive arrangements, most expansively, may need to be renegotiated to conform to the requirements and, at a minimum, may need to be documented in a more robust fashion to ensure evidence of compliance can be furnished upon request. The impact of QIA expenditures that are no longer able to be included in the MLR numerator will need to be modeled to ensure that a resulting failure to meet any minimum MLR requirements does not occur and, if this is projected to occur, a strategy will need to be developed and executed to ensure it does not. Expense allocation methodologies will need to be documented more extensively and evaluated for reasonability to ensure that they can withstand regulatory scrutiny when additional detail is provided to state Medicaid agencies.
Medicaid and CHIP Quality Rating System (MAC QRS)
In the proposed rule, CMS outlines a MAC QRS framework that includes: (1) mandatory quality measures, (2) a quality rating methodology, and (3) a mandatory website display format. State Medicaid agencies and MCOs will be required to adopt and implement the MAC QRS framework developed by CMS or adopt and implement an alternative managed care quality rating system. CMS will update the mandatory measure set at least every other year. Measures will have public notice through a call letter (or similar guidance) on any planned modifications with measures being based on: (1) value in choosing an MCO, (2) alignment with other CMS programs, (3) the relationship to enrollee experience, access, health outcomes, quality of care, MCO administration, or health equity, (4) MCO performance, (5) data availability, and (6) scientific acceptability.
State Medicaid agencies will be required to collect from MCOs the data necessary to calculate ratings for each measure and ensure that all data collected are validated. Additionally, state Medicaid agencies must calculate each measure and issue ratings to each MCO for each measure. Finally, the mandatory state website will be required to contain the following elements: (1) clear information that is understandable and usable for navigating the website itself, (2) interactive features that allow users to tailor specific information, such as formulary, provider directory, and ratings based on their entered data, (3) standardized information so that users can compare MCOs, (4) information that promotes beneficiary understanding of and trust in the displayed ratings, such as data collection timeframes and validation confirmation, and (5) access to Medicaid and CHIP enrollment and eligibility information, either directly on the website or through external resources.
For local and regional MCOs, the MAC QRS framework proposed by CMS will require assessing their capability to produce the mandated data upon request by state Medicaid agencies. It will also then require ensuring that all mandated data is available to be provided on an annual basis. To the extent possible, at the appropriate time, assessing baseline performance on measures and proactively developing and implementing strategies to improve performance will be prudent. Assessing the impact of the greater transparency around quality performance that the proposed MAC QRS will bring in order to understand the potential impact on competitive position will also be important.
Network Adequacy Requirements
In the proposed rule, CMS outlines important network adequacy requirements meant to further timely access to care for Medicaid and CHIP managed care enrollees. Two of these are focused upon here: (1) appointment wait time standards and (2) secret shopper surveys. Other policies to enhance access are also included in the proposed rule including, for example, a requirement that state Medicaid agencies conduct an annual enrollee experience for each MCO.
For appointment wait time standards, CMS proposes that state Medicaid agencies develop and enforce wait time standards for routine appointments for four types of services: (1) outpatient mental health and substance use disorder (SUD) for adults and children, (2) primary care for adults and children, (3) obstetrics and gynecology (OB/GYN), and (4) an additional service type determined by the state Medicaid agencies in an evidence-based manner (in addition to the previous three noted). The maximum wait times must be no longer than 10 business days for routine outpatient mental health and SUD appointments and no longer than 15 business days for routine primary care and OB/GYN appointments. State Medicaid agencies could impose stricter wait time standards but not more lax ones. The wait time standard for the fourth service type selected by state Medicaid agencies will be determined at the state level.
For secret shopper surveys, state Medicaid agencies will be required to utilize an independent entity to conduct annual secret shopper surveys to validate MCO compliance with appointment wait time standards and the accuracy of provider directories to identify errors as well as providers that do not offer appointments. For an MCO to be compliant with the wait time standards, as assessed through the secret shopper surveys, it would need to demonstrate a rate of appointment availability that meets the wait time standards at least 90% of the time. State Medicaid agencies would be required to develop remedy plans when MCO compliance issues are identified which designate the party responsible for taking action, outline the appropriate steps to be taken to address the issue, and document the intended implementation timeline.
For local and regional MCOs, the wait time standards and secret shopper surveys present opportunities to prepare to ensure compliance and to collaborate with state Medicaid agencies. For preparation, undertaking secret shopper surveys ahead of implementation to determine the current performance relative to maximum wait times may be advisable. Additionally, there is an opportunity to collaborate with state Medicaid agencies regarding the selection of the fourth service type for which wait time standards will be established.
For More Information
If you have questions about how HMA can support your efforts related to the proposed rule’s implications for local and regional MCOs, please contact our experts below.