HMA Insights: Your source for healthcare news, ideas and analysis.
HMA Insights—including briefs, webinars, and our podcast—gives you easy access to HMA’s deep expertise, helping you stay current on the latest healthcare trends and topics. Search for a topic of interest or browse the latest insights below.
As we approach the end of 2025, the Affordable Care Act (ACA) Marketplaces face a pivotal moment. Enhanced Advance Premium Tax Credits (APTCs), introduced under the American Rescue Plan Act (ARPA) and extended through the Inflation Reduction Act (IRA), have driven enrollment to 24 million individuals now covered through the Marketplaces. Without congressional action, these subsidies expire on December 31, 2025.
HMA and Wakely, an HMA Company, have released updated analysis that compares enrollee out-of-pocket spending of ACA marketplace enrollees to other major payers using claims data. The brief answers key questions about Marketplace enrollees and whether they spend more or less out-of-pocket relative to Medicare, ESI and Medicaid enrollees.
HMA and Wakely, an HMA Company, have released an updated Issue Brief to the comprehensive profile of ACA Marketplace enrollees that was based on claims data from nearly 6 million of the 24 million Marketplace enrollees.
The issue brief discusses these key questions:
Do Marketplace enrollees spend more or less out-of-pocket relative to Medicare, ESI and Medicaid enrollees?
How may the potential expiration of eAPTCs impact out-of-pocket costs?
What are some initial considerations regarding overall healthcare affordability?
Please fill out this form to receive a copy of the update and issue brief.
Contact any of the report authors with further questions, or to discuss potential applications of this work for your organization.
This proposed rule offers a road map for CMS’s vision for Medicare Advantage (MA) and Part D. Signaling how CMS leadership intends to shape the MA and Part D programs beyond 2027—prioritizing outcomes, streamlining operations, and inviting dialogue on modernization—the proposed rule reflects a strategic imprint on the program’s trajectory. The deadline to submit comments isJanuary 26, 2026.
Given CMS’s goal of modernizing MA and Part D, plans, providers, and advocates should engage early to inform final policies. Health Management Associates (HMA) policy and actuarial experts, including Wakely and Leavitt Partners (both HMA companies), are analyzing and modeling the effect of the proposed changes. This article highlights some of the major policy updates that require near-term planning by states, Medicare Advantage plans, providers who serve MA beneficiaries, and their partners.
Key Themes in the Proposed Rule
Requests for Information
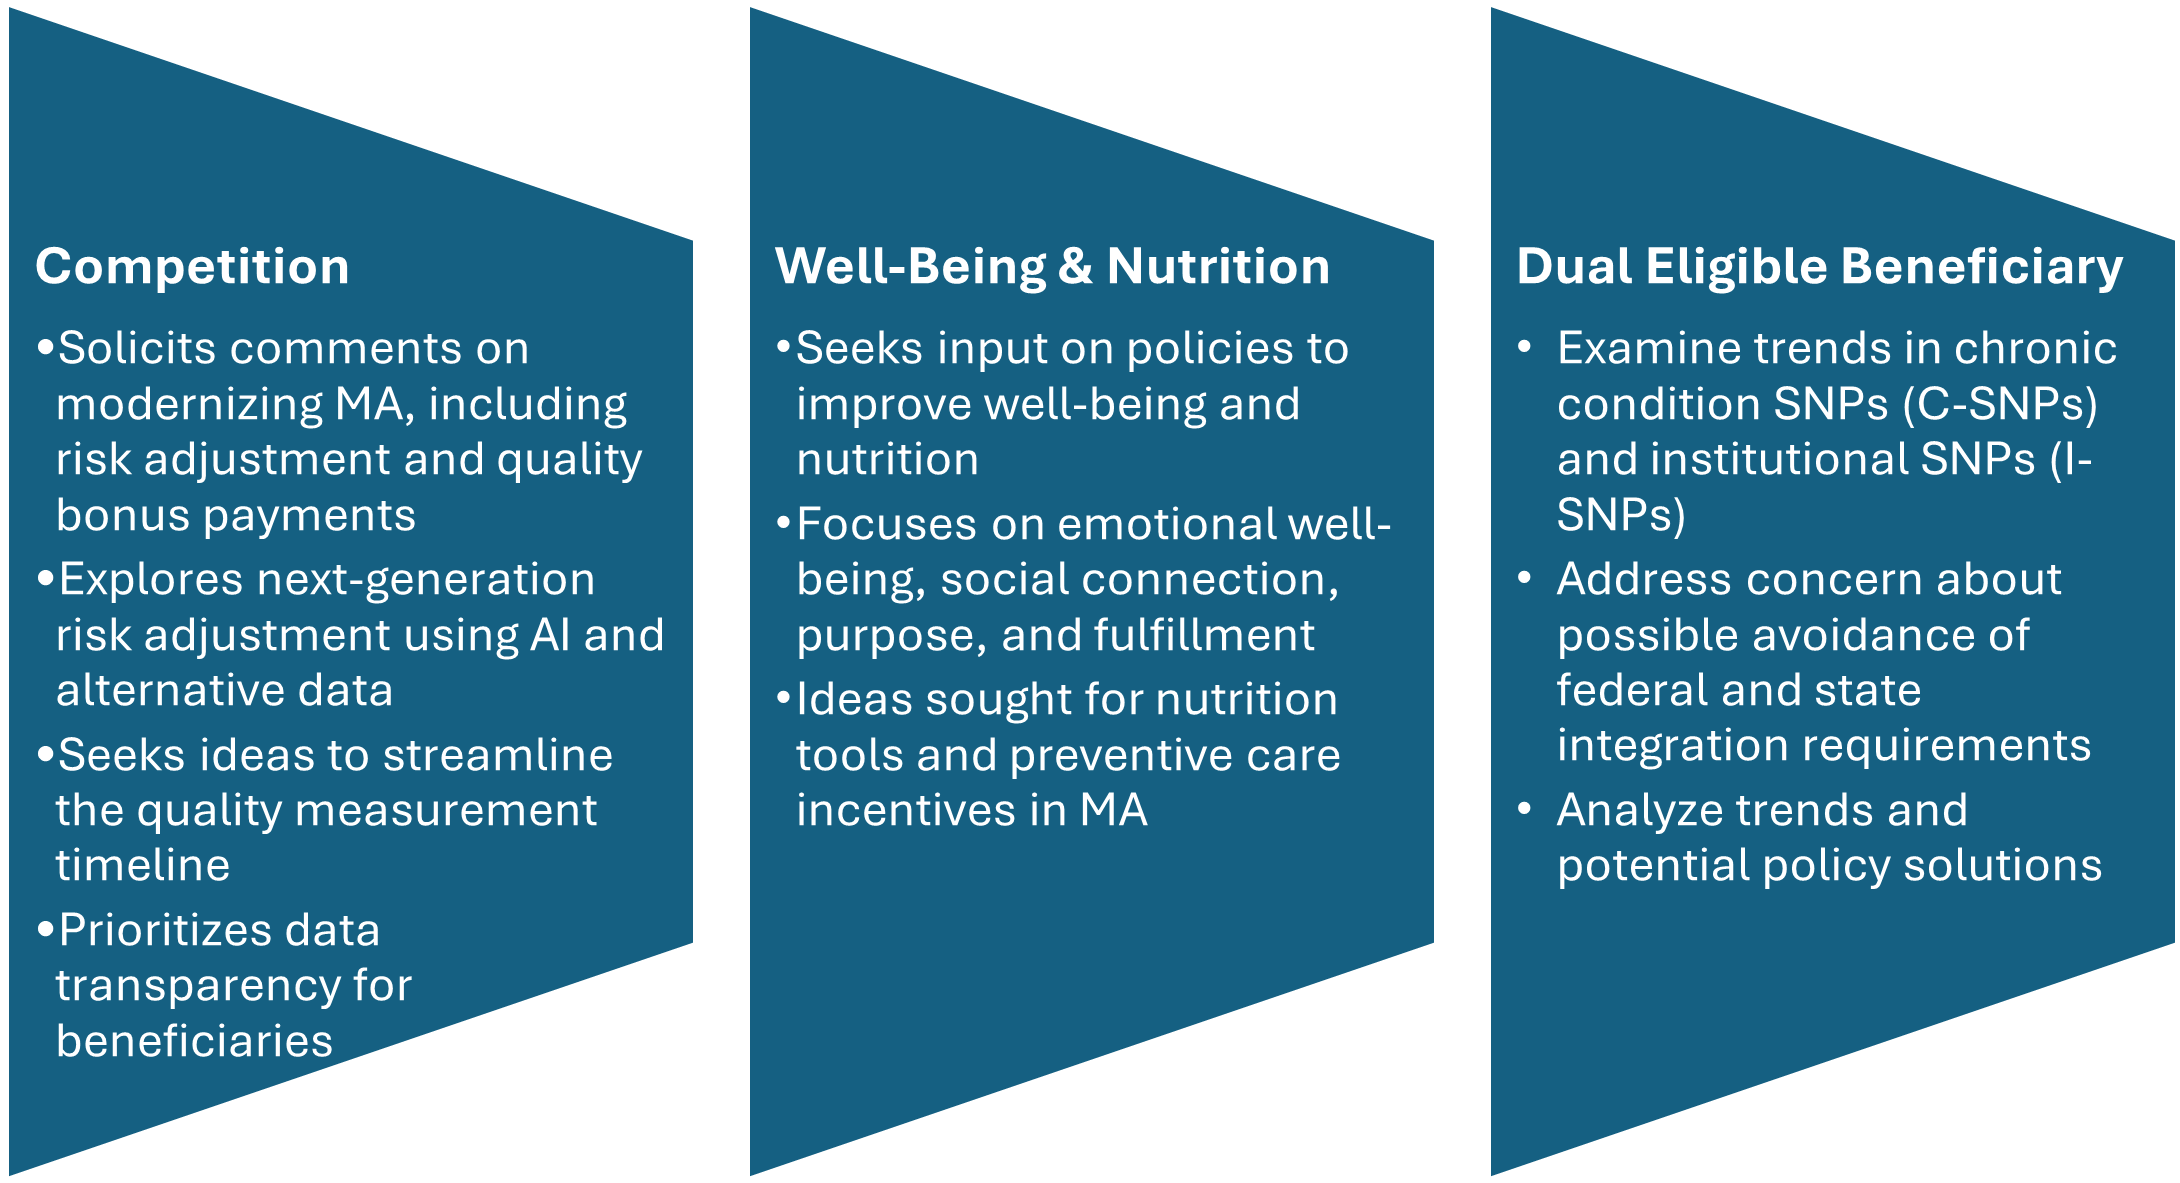
CMS includes three significant requests for information (RFIs) and highlights additional opportunities to provide input on approaches to reduce administrative burden throughout the program. CMS’s modernization RFI focuses on financing and other strategies to support beneficiaries with plan selection. In addition, CMS seeks input on emerging trends in MA special needs plans (SNPs), citing concerns about rapid growth and potential program integrity issues. Consistent with the departmentwide priorities, the RFI also delves into potential strategies for plans to address nutrition and wellness benefits for MA enrollees.
Figure 1. RFIs Signaling New Policy Directions
Star Ratings Overhaul: Refocusing on Outcomes and Experience
CMS proposes significant changes to the Star Ratings system, which influences plan bonuses and consumer choice. The changes increase the focus on clinical care, outcomes, and patient experience of care measures where performance is not topped out and align with universal foundation of measures.
Health Equity Index Rollback: Rather than implement the previously planned Excellent Health Outcomes for All reward (formerly Health Equity Index) for 2027, the agency will continue using the historical reward factor that incentivizes consistently high performance across all measures.
Measure Streamlining: Twelve process-heavy or administrative measures will be removed.
Behavioral Health: A new measure for depression screening and follow-up will be introduced for the 2027 measurement year, with integration into Star Ratings by 2029.
Why It Matters: Removing these measures continues the shift away from administrative compliance, easing burden while strengthening quality incentives.
Medicare and Medicaid Dual Eligible SNPs and Integration
CMS is proposing several changes to improve how Medicare Advantage plans serve people who qualify for both Medicare and Medicaid (dual-eligible beneficiaries):
Starting in calendar year (CY) 2027, CMS proposes to allow D-SNPs and I-SNPs two opportunities to change to their model of care (MOC)—the framework for how they coordinate care. These windows would be January 1 through March 31 and October 1 through December 31.
When beneficiaries are automatically moved (i.e., passively enrolled) from one integrated D-SNP to another, CMS will no longer require the new plan’s provider network to closely match the old plan’s network. Instead, the new plan must ensure that all incoming members receive uninterrupted care for at least 120 days (up from 90 days), helping prevent gaps in treatment.
In states where dually eligible individuals are explicitly carved out from or not required to enroll in Medicaid managed care, CMS proposes to let highly integrated dual eligible special needs plan (HIDE SNP) continue to enroll full-benefit, dual-eligible (FBDE) individuals in the same service area, even if those individuals are in Medicaid fee-for-service. This change is intended to maintain coverage and simplify enrollment for these beneficiaries.
Why It Matters: While the proposed changes revise broader policies, the updates could have significant effects on D-SNP and MA integration. These changes also could shape states’ decisions regarding their integration policies. Plans should continue to monitor these developments.
Other Notable Changes
CMS proposes a new special enrollment period (SEP) for beneficiaries when their providers leave a plan’s network, eliminating the requirement that CMS deem the change “significant.” The intent of this change is to preserve continuity of care and ease the burden of beneficiaries switching plans. In addition, CMS plans to codify SEP policies for greater consistency.
The proposed rule also calls for the following:
Codifying multiyear changes stemming from the Inflation Reduction Act, including elimination of the coverage gap phase
Lowering annual out-of-pocket thresholds and removal of cost sharing in catastrophic coverage
Transitioning to the Manufacturer Discount Program and updating true out-of-pocket (TrOOP) calculations
Clarifying specialty-tier drugs and subsidy structures
As a result, plans will have updated financial responsibilities.
Connect With Us
As CMS sets a new course for Medicare Advantage and Part D, organizations face both opportunities and challenges in adapting to these changes. HMA brings deep expertise in Medicare policy, actuarial modeling, and operational strategy. Our team—including experts from Wakely and Leavitt Partners—can help plans, providers, and stakeholders interpret the proposed rule, assess its impact, and develop actionable strategies for compliance and competitive positioning.
Whether you need data-driven analysis, scenario modeling, or hands-on support preparing for implementation, HMA is ready to partner with you to navigate the evolving Medicare landscape and achieve your goals. Contact our experts below to discuss your questions and how HMA can help.
At the National Association of Medicaid Directors (NAMD) 2025 Fall Conference, planned federal health policy changes dominated conversations among attendees, including state Medicaid directors, health plans, and providers. With major changes on the horizon for Medicaid and Affordable Care Act (ACA) Marketplace programs, stakeholders are preparing for transition and transformation in 2026.
A team from Health Management Associates (HMA) attended the conference and returned with valuable insights on the emerging opportunities, state-specific priorities for 2026 and beyond, and early strategies to address and mitigate the challenges ahead. Among the topics discussed were the Rural Health Transformation Program (RHTP), Medicaid eligibility and community engagement policy changes, drug costs and financing, upstream drivers of health, and data infrastructure.
Five major takeaways about the work state Medicaid agencies, health plans, providers, and industry partners will focus on in the year ahead were as follows.
1. Medicaid leaders are preparing for new eligibility and community engagement policies under tight timelines.
The 2025 budget reconciliation act (P.L. 119-21, OBBBA) requires certain adults ages 19–64 enrolled in Medicaid to complete at least 80 hours per month of community engagement (CE) to maintain coverage. Exemptions to the CE requirement apply to people with disabilities, pregnant individuals, and caregivers. States must now develop processes and information systems that track and verify compliance with CE requirements, manage exemptions, and support members through this policy change.
Medicaid CE and other new eligibility requirements, including more frequent eligibility checks, were a frequent topic of discussion throughout the event. Implementation of these requirements is a major operational lift with significant program integrity implications. State leaders discussed the tight timelines, resource constraints, and the need to coordinate across agencies, health plans, and providers. They are already planning to mitigate the risk of coverage losses for at-risk populations and to minimize administrative burden for all stakeholders. The urgency and complexity of these changes underscore the need for strategic planning and cross-sector collaboration.
2. Coordinated communication and stakeholder engagement remain critical.
States are increasingly relying on multiple forms of communication and feedback channels to engage stakeholders, including Medicaid members. Clear, timely communication is essential to ensure people understand their options and know what they need to do and when to do it. Medicaid leaders described the value of embedding vital eligibility information into workflows at all levels and applying lessons from the COVID-19 public health emergency unwind to new outreach and education initiatives.
Several states emphasized the effectiveness of convening all stakeholders to ensure unified messaging. Other common themes included the importance of plain-language materials, hands-on support through case managers and navigators, and engaging providers to integrate new eligibility and work-related requirements into their workflows, as policies evolve.
3. States are eager to begin implementing initiatives in their rural health transformation plans.
Medicaid leaders are actively discussing their RHTP applications with CMS, preparing to move quickly once awards are announced. Many states are focused on enhancing existing efforts, while others are preparing to invest in systems, technology, and organizations that will better integrate rural providers into the broader healthcare system, including Medicaid.
Federal and state leaders and their partners discussed the opportunity for RHTP funding to strengthen rural health infrastructure, workforce development, education, and outreach—especially in underserved areas. States are positioning themselves to leverage these funds to address persistent disparities and improve access to care for rural populations.
4. States are seeking to balance cost and access to GLP-1s and other prescription drugs.
Federal and state leaders extolled the benefits of new and innovative prescription drug products and therapies, including GLP-1s. Centers for Medicare & Medicaid Services (CMS) Administrator Dr. Mehmet Oz highlighted the administration’s announcements about drug pricing, including the new GENEROUS (GENErating cost Reductions fOr US Medicaid) model, which is focused on drug costs in the Medicaid program. These discussions reinforced CMS’s focus on new drug pricing models and the importance of involving Medicaid experts in these nuanced development and implementation conversations.
Attendees gained a deeper appreciation for the administration’s intent to have GLP-1s and other therapies play a significant role in addressing chronic disease, including obesity. State Medicaid agencies—and their Medicaid managed care plans and partners—should plan to inform discussions about coverage and financing of these novel products as well as for cell and gene therapies. The intersection of innovation, affordability, and access will remain a central challenge.
5. Medicaid agencies are working on multiple technology interoperability and quality initiatives.
Although Medicaid eligibility policy changes and CE requirements drew significant attention, many discussions also focused on other upcoming deadlines, including:
New federal interoperability and prior authorization rules that go into effect in 2027
State implementation of Medicaid and CHIP Quality Rating System requirements before the end of 2028
The transition to digital quality measurement (dQM) by 2030
Medicaid agencies are collaborating with managed care and provider organizations to understand the operational, clinical, and technical dimensions of these initiatives.
Connect with Us
HMA’s expert consultants provide advanced policy, technical, and operational support, and can help your organization navigate and succeed in the evolving regulatory landscape. Our team brings deep experience and practical solutions to help clients anticipate challenges, leverage opportunities, and achieve their program goals. For more information or technical assistance on these and other emerging Medicaid priorities, contact the HMA’s featured experts below.
The Massachusetts Executive Office of Health and Human Services has begun early stakeholder engagement for the next Section 1115 demonstration waiver from 2028 to 2032, which will reflect the priorities of MassHealth, the Commonwealth’s Medicaid and CHIP (Children’s Health Insurance Program) system. The program covers roughly two million residents and operates with a budget of more than $20 billion in annual state and federal spending.
In two public meetings November 10 and 17, 2025, senior officials from MassHealth—Ryan Schwarz and Caitlin Towey—outlined MassHealth’s early thinking for the next 1115 demonstration in the “Roadmap for MassHealth’s 2028–2032 1115 Demonstration Extension,” released in October 2025. They emphasized the Commonwealth’s commitment to preserving core programs while acknowledging a more challenging federal landscape than in prior waiver cycles.
The roadmap highlights the 28-year trajectory of progress enabled by Massachusetts’ 1115 authority—from establishing the Accountable Care Organization (ACO) model and expanding substance use disorder (SUD) treatment, to strengthening safety net providers and driving the uninsured rate to 3 percent, the lowest in the nation. More recent demonstration cycles have deepened primary care investments, expanded the behavioral health continuum, advanced health equity incentives, and integrated housing and nutrition supports into ACO benefits.
Nonetheless, the roadmap also underscores the significant headwinds that are shaping the next waiver. The federal budget reconciliation act (P.L. 119-21, OBBBA) signed in July 2025 is projected to result in coverage losses for up to 300,000 Massachusettsresidents and as much as $3.5 billion in lost annual federal healthcare funding. Meanwhile, new federal policy stances, such as rescinding health-related social needs (HRSN) guidance and discontinuing approval of continuous eligibility authorities, will require Massachusetts to rethink elements of its current demonstration. State budget pressures are also a factor. MassHealth now accounts for nearly one-third of total state spending.
A major source of uncertainty is the lack of federal guidance on several core elements of the existing waiver. During November’s stakeholder sessions, state leaders said they are still awaiting direction from the Centers for Medicare & Medicaid Services (CMS) on several issues, including budget neutrality, hospital transformation funding, and HRSN services.
HRSN: Current HRSN initiatives were enabled by guidance issued under the Biden Administration, which has since been rescinded. MassHealth officials said they intend to request approval for HRSN-like services in the upcoming waiver, even if the program must be redesigned or authorized through different mechanisms.
Workforce Initiatives: Workforce funding, currently about $40 million over five years, will not be allowed under 1115 authority moving forward. State officials said they must identify alternative pathways to sustain or reconfigure workforce efforts if they are to continue.
ACO & MCO Programs: Stakeholders asked for updates to the ACO and managed care organization (MCO) programs. MassHealth confirmed that the current ACO contracts run through December 31, 2027; however, they did note that Tufts Health Plan will exit the MCO program at the end of 2025, though this will have no effect on MassHealth’s two ACOs. Future ACO and MCO re-procurements could lead to changes, but those decisions remain several years out.
Behavioral Health: Behavioral health policy also drew substantial interest. The state is assessing its behavioral health diversion system to determine which components require continued 1115 authority and where changes may be needed. Officials also confirmed that they intend to request continued 1115 authority for the Program for Assertive Community Treatment (PACT)—a multidisciplinary service for individuals with serious mental illness.
Primary Care: Officials described a “crisis in primary care access”, driven by provider shortages and prolonged underinvestment. Although Massachusetts has historically led the nation in primary care spending, state leaders noted that the 1115 waiver alone cannot resolve these challenges. Gov. Maura Healey’s administration has convened a new task force to assess primary care access and financing, and MassHealth indicated it intends to align with that panel’s work.
Cost Containment: Cost containment remains a priority. Officials said managing rising program costs is a theme that will be embedded throughout the renewal process.
As that effort unfolds in 2026, the State appears to be focused on maintaining core programs, adapting to uncertain federal guidance, and preserving flexibility. Officials said they are evaluating whether some current initiatives may need to shift from waiver authority to the State Plan, depending on forthcoming CMS policies. They are also closely monitoring other states’ expiring waivers to understand what CMS may approve under the current administration.
HMA experts have extensive expertise in helping to draft, implement, and evaluate 1115 demonstrations across the country. Our team in Massachusetts will be following the Commonwealth’s efforts closely and are available to answer your organization’s questions on how to navigate these new developments.
Solutions for behavioral health workforce shortages
Growing demand and need for BH services is outpacing workforce capacity nationally.
In 2024, 43 of the 44 states responding to an NRI survey reported a behavioral health workforce shortage[1]. States, Health Plans and Provider Associations are all struggling with how to manage the problem.
A standardized approach to assessing BH workforce shortages can help states and organizations better design sustainable workforce solutions, especially considering challenges federal funding changes and the need for diverse care needs across rural and urban areas across the US. Recommendations are grounded in lived experience, policy fluency, and practical feasibility.
Support infrastructure and policy alignment grounded in community partnerships
Expert Analysis
Interpret data using specialized tools, knowledge, experience, and context
Strategic Planning
Define goals, align resources, and guide decisions
A Standardized Approach
HMA’s framework helps states, health plans, and provider associations and organizations design sustainable workforce solutions, especially considering challenges like the need for diverse care needs and regionally appropriate strategies. Our work delivers measurable, generalizable, lasting improvements, and provides a window into obvious partnership opportunities for workforce development projects in both rural and urban communities. The recommendations are grounded in lived experience, policy fluency, and practical feasibility.
Our Services
With a deep understanding of current and emerging shifts in care and policy, our BH workforce consultants are well equipped to provide support and implementation of workforce initiatives across a variety of content areas over a flexible duration.
Rapid Deployment of Existing Strategies
Preparation & Education
Evaluation & Analysis
Implementation & Support
Strategic Assessment
Regulatory & Policy Consulting
Proven Results
HMA has worked on national projects aimed at resolving workforce shortages. HMA is a founding member of the Workforce Solutions Partnership, a collaboration among the College for Behavioral Health Leadership and the National Council for Mental Health Wellbeing. HMA has a national lens on the behavioral health workforce experiences and has worked with clients to identify pathways to strengthen and diversify the workforce in ways that are equitable, sustainable, and community informed. Our established services ensure that we translate insights from our methods into actionable and meaningful recommendations for workforce development.
HMA Differentiators
Many of our team members are former executives and clinical leaders from the BH workforce sector, including doctors, policy experts, social workers and administrative leaders from health plans, health systems, community-based organizations, FQHCs, and government agencies at the local, state and national levels. Our clinicians bring decades of experience leading BH care in inpatient, outpatient and emergency department settings.
OUR EXPERTISE
HMA subject matter experts with national BH workforce experience analyze existing data—such as strategic plans, funding streams, licensing, and workforce initiatives—to identify policy gaps, infrastructure readiness, and innovative care models.
With a deep understanding of current and emerging shifts in care and policy, our BH Workforce consultants are well equipped to provide specialized services.
Working to integrate services across systems and communities, Paul Fleissner is a seasoned executive who has developed programs and policies … Read more
Allie Franklin is a licensed clinical social worker with decades of experience in public, private, and non-profit behavioral health, healthcare, … Read more
Jill Kemper has extensive experience improving access to care and care delivery, especially for vulnerable or complex patient populations and … Read more
Released before the NAMD 2025 Fall Conference, Medicaid directors’ insights and the challenges, priorities, and innovations shaping Medicaid programs in fiscal years (FYs) 2025 and 2026 will figure prominently at this event. A team of HMA experts will be in attendance and available to address new developments and opportunities in state Medicaid policy and financing.
Key Trends and Challenges
Fiscal Pressures and Budget Uncertainty
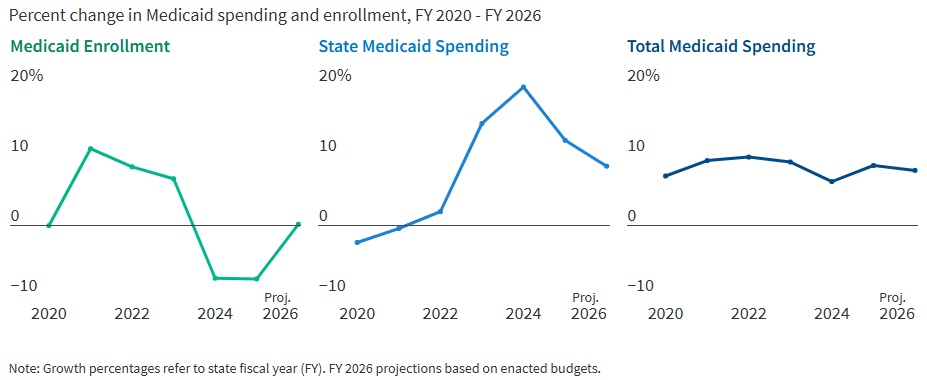
States are entering FY 2026 with slower revenue growth and rising healthcare costs. In FY 2025, Medicaid enrollment dropped by 7.6 percent as pandemic-era continuous coverage policies ended, but spending continued to climb. In fact, total Medicaid spending grew 8.6 percent in FY 2025 and is projected to rise another 7.9 percent in FY 2026. State Medicaid spending growth is expected to slow from 12.2 percent in FY 2025 to 8.5 percent in FY 2026. Nearly two-thirds of Medicaid directors, however, thought the odds of a Medicaid budget shortfall in FY 2026 was “50-50,” “likely,” or “almost certain.” Cost drivers include increases in provider rates, higher acuity enrollees, greater long-term care and behavioral health utilization, and rising pharmacy costs, especially for specialty drugs.
Figure 1. Medicaid Spending and Enrollment Trends Since the COVID-19 Pandemic Began
Source: Medicaid Enrollment & Spending Growth: FY 2025 & 2026. FY 2025‒2026 spending data and FY 2026 enrollment data are derived from the annual KFF survey of state Medicaid officials that HMA conducted in November 2025. Historic data reflects growth across all 50 states and DC and comes from various sources.
Federal Policy Changes and Provider Taxes
States are preparing for major federal policy changes under the 2025 budget reconciliation law (OBBBA), which will reduce federal Medicaid funding and impose new eligibility requirements. On November 14, 2025, the Centers for Medicare & Medicaid Services issued guidance regarding the OBBBA’s restrictions on states’ ability to use healthcare-related provider taxes to finance Medicaid programs (see CMS Provider Tax Guidance Places New Pressures on Medicaid Budgets). States are now generally prohibited from enacting new provider taxes or increasing existing ones after July 4, 2025, and must comply with new rules by the end of FY 2026 or FY 2028, depending on the tax type. In particular, beginning in federal FY 2028, the OBBBA gradually reduces the safe harbor provider tax limit for states that have adopted the ACA Medicaid expansion by 0.5 percent annually until the safe harbor limit reaches 3.5 percent of net patient revenues in federal FY 2032. These changes will reduce states’ flexibility to use provider taxes as a source of non-federal Medicaid funding, potentially leading to budget gaps and reductions in provider payments if lost revenue cannot be replaced.
Policy Changes and Priorities
Managing Risk in Managed Care Programs
A total of 46 states operate some form of managed care, and capitated managed care remains the predominant delivery system for Medicaid in most states. Most states that contract with capitated managed care organizations (MCOs) reported imposing a minimum medical loss ratio (MLR) requirement, requiring remittance payments when an MCO falls short of the minimum MLR requirement, and using risk corridors to manage financial risk and ensure value. States are also grappling with the growing use of artificial intelligence, particularly in the context of managed care prior authorization. Early policies focus on transparency, oversight, and ensuring human review to address concerns about bias, inappropriate denials, and privacy risks.
An Uptick in Provider Rate Reductions and Provider Tax Restrictions on the Horizon
Most states implemented fee-for-service rate increases for at least one provider category in FY 2025 and FY 2026. The number of increases is slowing, however, and there was an increase in states reporting provider rate restrictions compared with previous years. States continue to target rate increases for nursing facilities and home and community-based services more than other provider types.
Provider taxes remain a key source of the non-federal share of Medicaid funding, with all states except Alaska having at least one tax. These taxes accounted for a median 18 percent of states’ FY 2026 non-federal Medicaid financing, but new federal restrictions enacted in the OBBBA will limit states’ ability to use or expand these taxes going forward. As of July 1, 2025, 31 Medicaid expansion states reported having a non-exempt provider tax greater than the 3.5 percent of net patient revenues and therefore subject to the OBBBA’s phase down requirement.
Strong Benefit Enhancements and Scrutiny of Prescription Drugs
New Medicaid benefits and benefit enhancements continued to outpace benefit cuts and limitations. In all, 37 states reported new or enhanced benefits in FY 2025, and 36 plan to add or enhance benefits in FY 2026. More specifically, states reported expanding services across the behavioral health care continuum and for prenatal, delivery, and postpartum services. Most states reported at least one new or expanded initiative to contain prescription drug costs, including participation in the Centers for Medicare & Medicaid Services (CMS) Cell and Gene Therapy Access Model. State responses also reflected a waning interest in expanding Medicaid coverage for costly obesity drugs (GLP-1s), with some states restricting coverage because of budget pressures.
Challenges and Priorities
Many states are confronting more difficult fiscal conditions while also preparing for future fiscal uncertainty driven, in part, by the OBBBA. Medicaid leaders also expressed concern about the complexity of implementing new federal requirements, including work requirements and more frequent eligibility determinations. At the same time, state Medicaid leaders reported that they continue to pursue a variety of program priorities to expand access, especially to behavioral health and long-term care services, implement initiatives targeting specific populations (e.g., people who are pregnant, justice-involved, and at risk of homelessness), reform and strengthen delivery systems, modernize IT systems and infrastructure, and expand program integrity efforts.
Connect with Us
States face a challenging fiscal environment as they balance cost containment, quality, and access in their Medicaid programs. The combination of rising healthcare costs, new federal restrictions on provider taxes, and anticipated funding reductions will require states to make decisions about coverage, benefits, and provider payments. Nonetheless, states remain committed to maintaining quality and access for Medicaid beneficiaries, using available resources, and pursuing innovative approaches to care delivery.
For more information about the key takeaways from the KFF report and HMA’s Medicaid solutions, contact our experts below.
Keep up to date with the HMA Weekly Roundup.
We deliver timely, expert-driven updates to help you stay informed and ahead of the curve.
The Centers for Medicare & Medicaid Services (CMS) issued a letter on November 14, 2025, which provides preliminary guidance on healthcare-related taxes affected by Sections 71115 and 71117 of the Budget Reconciliation Act of 2025 (OBBBA, P.L. 119-21)—the portion of the legislation that focuses on new limitations on provider assessments.
Although this letter does not change federal regulations, it signals an important policy shift that will affect how states fund their Medicaid programs. CMS is working to incorporate these interpretations into rulemaking through the federal notice and comment process.
Health Management Associates (HMA) reviewed the letter specific to these provisions and in the context of other policy and financing changes that are affecting the Medicaid program. This article highlights key clarifications in the letter, the impact of the preliminary guidance on states, and the potential for the guidance to shape Medicaid budgets, financing strategies, and future policy reforms.
Guidance Clarifies the Meaning of “Enacted” and “Imposes”
OBBBA prohibits states from establishing new provider taxes after July 4, 2025. Existing provider taxes may be grandfathered if they meet specific criteria, but most taxes in expansion states—except those on nursing and intermediate care facilities—will be phased down starting October 1, 2027. To qualify for grandfathering, a tax must be both “enacted” and “imposed” by July 4, 2025, as defined by CMS.
CMS interprets enacted and imposed in the following way.
Enacted: CMS defines enacted based on two components. First, the state or local government must have completed the legislative process to authorize the tax by July 4, 2025. Second, any necessary tax waiver of the broad-based and uniformity requirements must be approved no later than July 4, 2025. This interpretation will present challenges for some states as any pending tax waiver requests and approvals issued after July 4, 2025, will not qualify for grandfathering.
Imposed: In addition to the enacted requirements, a state must have been actively collecting revenue for the new tax as of July 4, 2025. CMS does appear to allow for instances in which a state’s routine collection and billing practices require the tax be paid on a delayed schedule—a common practice across states.
CMS may continue to approve pending state proposals for new and revised tax structures; however, with the approvals, CMS is also notifying states that any tax structure that is ineligible for grandfathering must be revised by October 1, 2026, to comply with Section 71115 of the OBBBA.
Guidance Sets Preliminary Timeline for Compliance with New Broad-based and Uniformity Requirements in Section 71117
The OBBBA and a separately proposed rule published in May 2025 provide CMS with additional flexibility to tighten requirements for waivers that allow states to impose provider taxes that are not broad-based and uniform (i.e., the tax is levied on providers in a class at a common rate). CMS believes states have used a strategy to pass the prescribed statistical test for these waivers while shifting a disproportionate share of tax burden to high Medicaid providers.
The November 14 letter also includes a preliminary timeline for states to restructure their taxes to comply with the new requirements related to waivers of the broad-based and uniformity tests.
MCO taxes: States that levy a higher tax rate on Medicaid managed care organizations (MCOs) than on other MCOs must submit a revised tax structure applicable to the state fiscal year (SFY) starting in calendar year (CY) 2026.
Taxes on all other provider types: States with a similar tax structure on another provider class would need comply by the conclusion of the SFY, ending in CY 2028.
CMS notes that the preliminary timeline for the MCO taxes is the minimum transition period, and the final rule may allow for a transition period of up to three fiscal years.
What It Means for States
All states except Alaska rely on one or more provider tax(es) to fund their Medicaid programs. These additional limitations on the uses of provider taxes—including those now in place—will put a significant strain on state budgets, beginning as early as October 1, 2026. States may need to reduce provider reimbursement and/or enrollee benefits to address these losses.
States and providers should start planning for the changes in revenue now. Strategic planning for provider tax sustainability and close monitoring of upcoming CMS rulemaking are essential.
Connect with Us
The potential impact will vary by state, and each tax structure should be individually assessed to fully understand the implications of this new guidance. HMA has designed, developed, and helped implement provider taxes across the country and is uniquely positioned to support states, MCOs, and providers as they navigate the evolving landscape.
For details about the federal guidance and considerations for your organization, contact our experts below.
Keep up to date with the HMA Weekly Roundup.
We deliver timely, expert-driven updates to help you stay informed and ahead of the curve.
As healthcare organizations face sweeping shifts in Medicaid funding, workforce costs, and payer expectations, leaders must think beyond short-term cuts and find sustainable ways to protect access, quality, and mission.
During this webinar, HMA experts Jose Robles, Juan Montanez, and Kristina Ramos-Callan discussed how hospitals, health systems, and providers can reimagine revenue strategy for the next decade.
Learning Objectives:
Understand the financial and operational implications of OBBBA and related regulatory changes on healthcare delivery.
Identify strategies to stabilize payer mix, manage revenue volatility, and mitigate the effects of coverage loss.
Explore technology and operational levers that enhance financial performance, including data analytics, automation, and care delivery redesign.
Examine how innovation and mission-driven decision-making can strengthen organizational resilience and maintain equity in care.
Apply insights to develop forward-looking plans that align fiscal responsibility with community health priorities.